5. Integrating Wazuh into the Homelab
This page is part of a broader series on creating a cybersecurity lab with VirtualBox.
Click here to return to the main project description page.
In this module, we’ll walk through the process of setting up a comprehensive Wazuh SIEM in our VirtualBox home lab, including Suricata, a Network Intrusion Detection System (NIDS) and several Host-based Intrusion Detection System (HIDS) agents.
Configuring Packet Capture
pfSense SPAN Interface
In this step, we’re adding an additional network interface to the pfSense VM. This interface will be used exclusively as a SPAN port to capture network traffic.
A dedicated document has been created to assist you in adding more interfaces and expanding the functionality of the lab environment as needed. [Click here](blog/2025/05/2025-05-12-Deploying a Cybersecurity Lab on VirtualBox.mdx) to read about it.
Execute the following Powershell commands, depending on how many interfaces you currently have, the numbering will differ. If you're stricly following this guide, it's the fifth.
& 'C:\Program Files\Oracle\VirtualBox\VBoxManage.exe' modifyvm "Homelab Firewall - PfSense" --nic5 intnet
& 'C:\Program Files\Oracle\VirtualBox\VBoxManage.exe' modifyvm "Homelab Firewall - PfSense" --nictype5 virtio
& 'C:\Program Files\Oracle\VirtualBox\VBoxManage.exe' modifyvm "Homelab Firewall - PfSense" --intnet5 "Homelab - SPAN"
& 'C:\Program Files\Oracle\VirtualBox\VBoxManage.exe' modifyvm "Homelab Firewall - PfSense" --nic-promisc5 allow-all
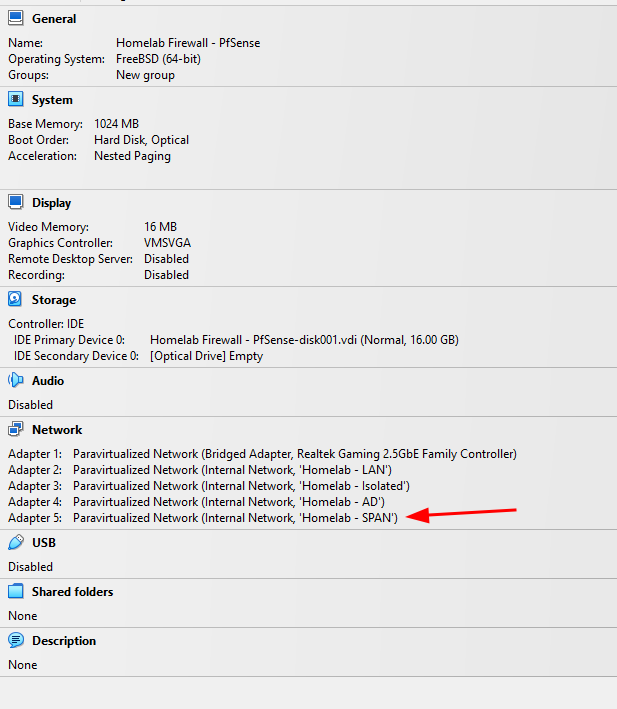
VirtualBox command to configure pfSense interface 5 as a SPAN port
What is a SPAN interface?
SPAN (Switched Port Analyzer) is a feature commonly found on managed network switches. It allows the switch to mirror all traffic from one or more source interfaces (ingress, egress, or both) to a designated destination interface, known as the SPAN port.
This destination interface — often called the SPAN interface — is used for passive monitoring and is typically connected to:
- A packet sniffer (e.g., Wireshark)
- A network intrusion detection system (IDS/IPS) such as Suricata or Zeek
- A traffic analysis or SIEM ingestion agent
Technical characteristics of a SPAN interface:
- It does not alter or interfere with the mirrored traffic.
- It usually has no IP address and is configured in promiscuous mode to capture all mirrored frames.
- It only receives packets — it cannot transmit traffic back into the network.
- It can monitor traffic from specific ports, entire VLANs, or even apply filters (depending on switch capability).
SPAN is often compared to RSPAN (Remote SPAN), which allows mirrored traffic to be forwarded across a dedicated VLAN to a remote monitoring device.
Use cases include:
- Security monitoring and threat detection
- Performance analysis and troubleshooting
- Regulatory compliance and auditing
Network Diagram Description
Referring back to our homelab's network diagram, the following setup is implemented:
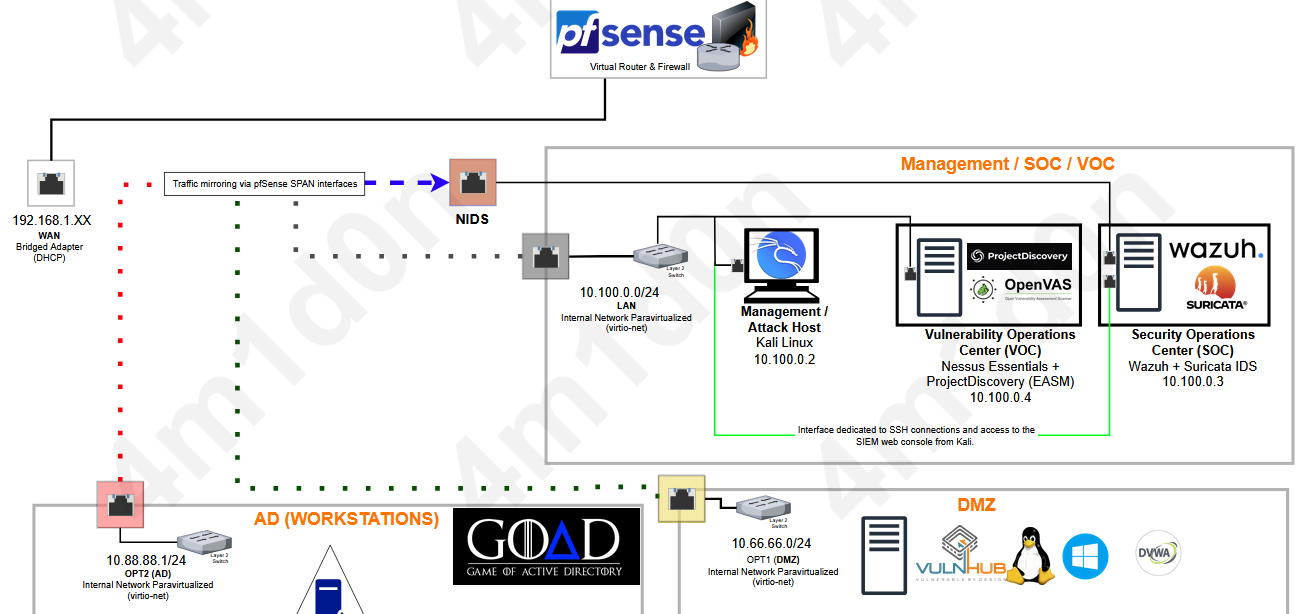
Architecture diagram showing the SPAN interface and Suricata traffic monitoring
- A new interface named
SPANis added to the pfSense VM. We labeled itNIDSwhich stands for Network Intrusion Detection System - The SIEM/IDS host is connected to both the
LANandSPANinterfaces:- The
LANinterface provides a DHCP-assigned IP address to the SIEM/NIDS host. - The
SPANinterface does not receive an IP address; it is dedicated to receiving mirrored Ethernet frames from the following interfaces:LANDMZAD
- The
- The mirrored traffic is analyzed by Suricata running on the SOC host.
- Logs and alerts generated by these tools are forwarded to the SIEM for centralized monitoring.
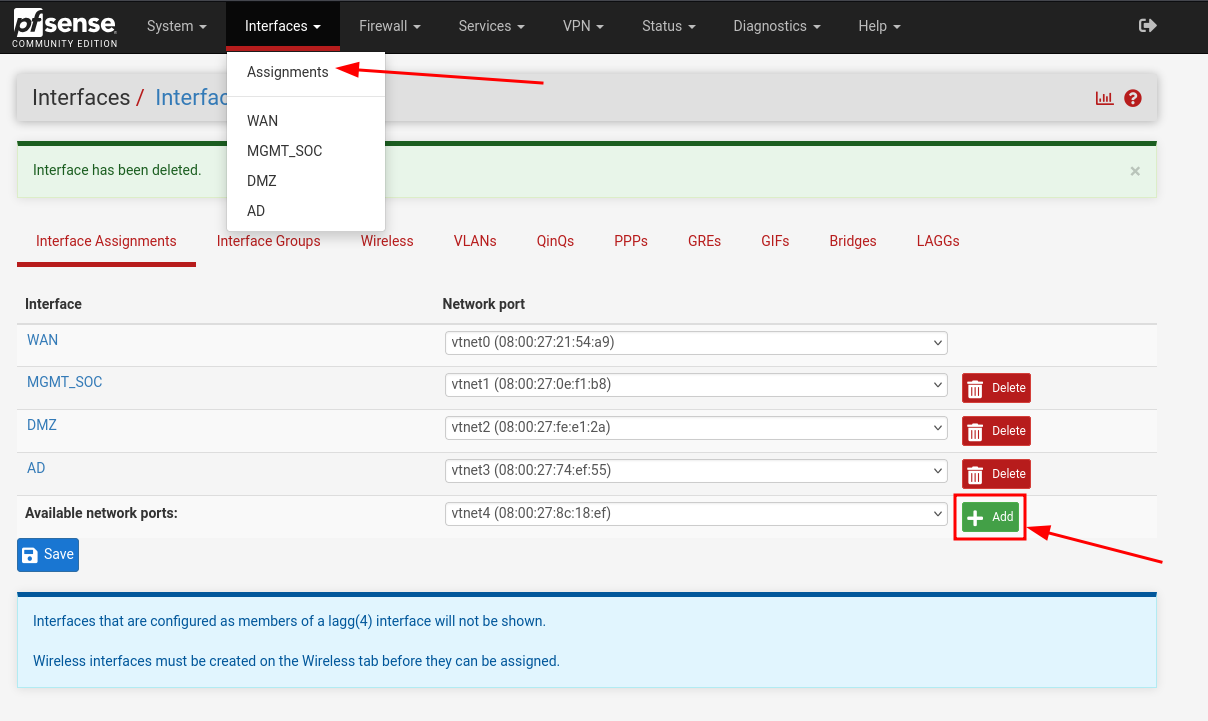
Log in to the pfSense Web Configurator, then navigate to Interfaces > Assignments
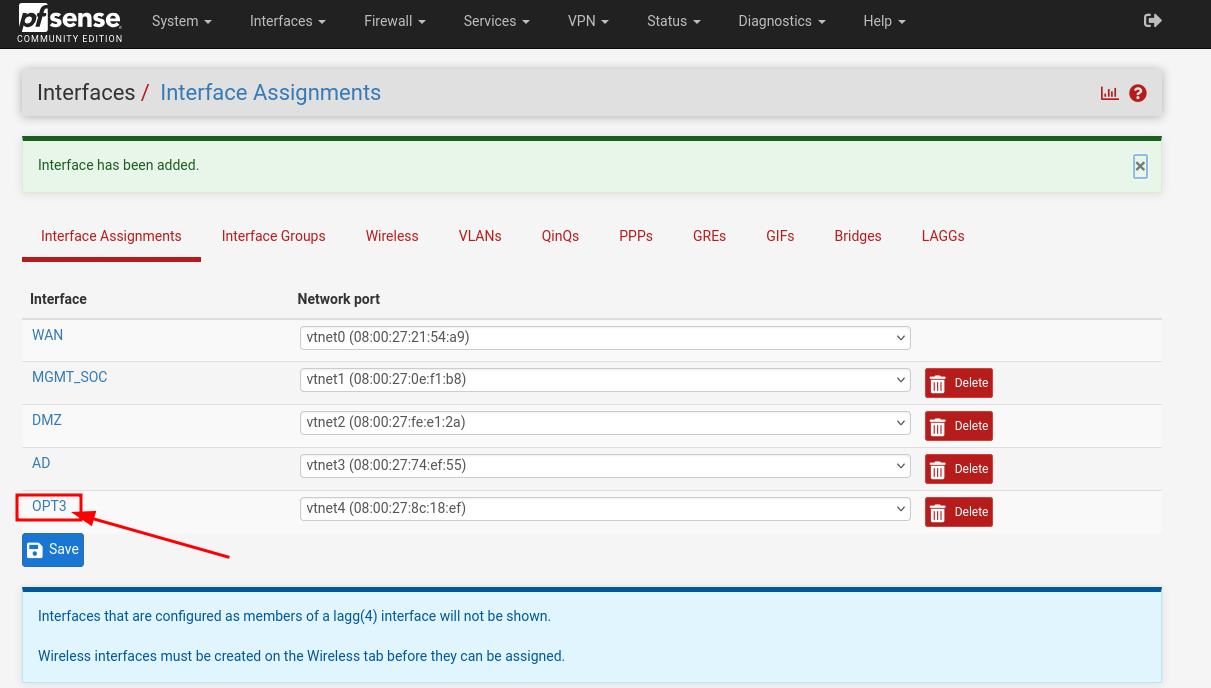
Click on OPT3, our newly added interface
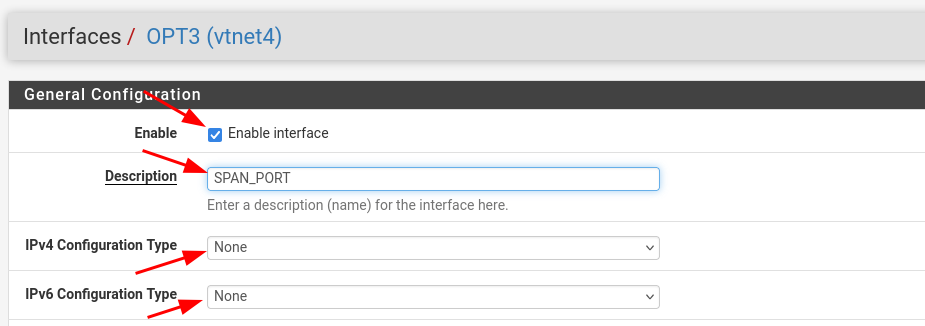
Enable it, add a description, and set both IPv4 and IPv4 configuration types to None

Hit Save
![]()
Don't forget to hit Apply changes
LAN to SPAN
This section explains how to mirror traffic from the LAN segment to the monitoring interface. This ensures that all internal workstation or attacker traffic traversing the LAN can be captured and analyzed by the NIDS or traffic inspection tools.
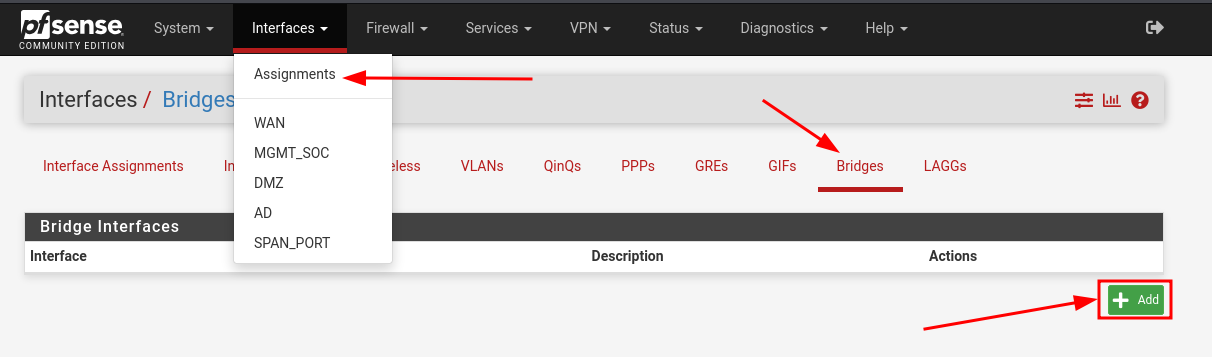
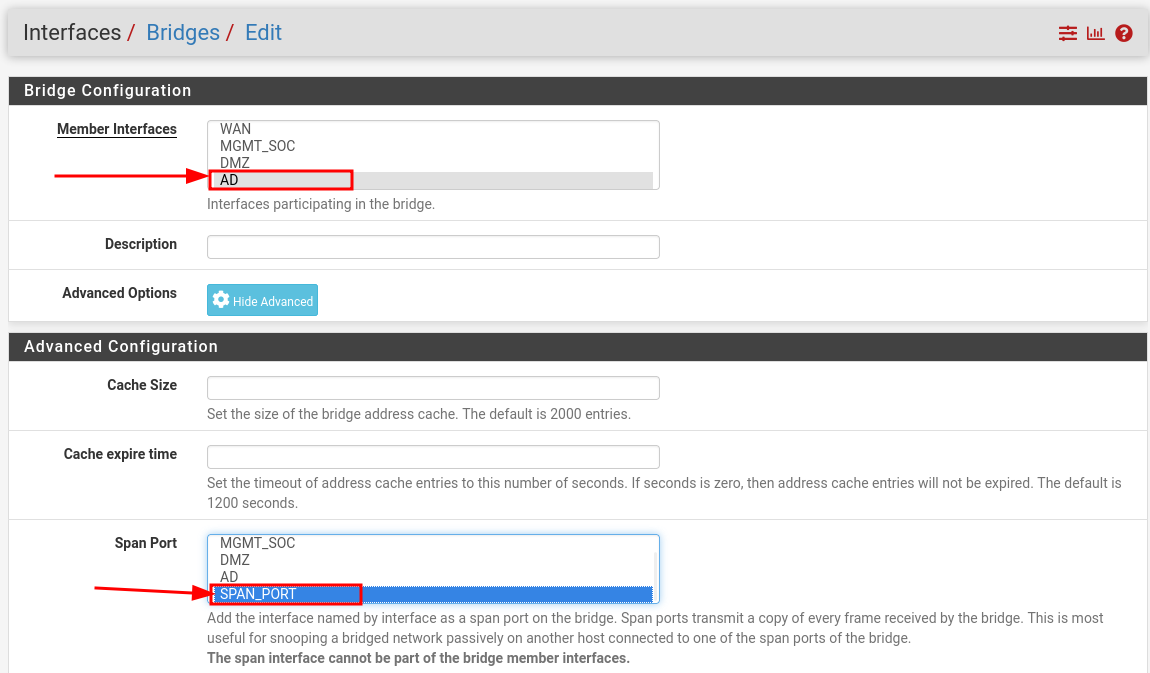
Click on Interfaces > Assignments > Bridges then hit Add
Create a bridge to mirror MGMT_SOC traffic to the SPAN interface
![]()
Hit Save
Each SPAN port must be configured individually. Selecting multiple target interfaces as member interfaces in a single configuration would place them in the same broadcast domain—an outcome we want to avoid.
Additionally, if you add new subnets to your pfSense-based cyber range in the future, you’ll need to repeat this procedure to ensure that traffic from those subnets is properly captured by the NIDS.
DMZ to SPAN
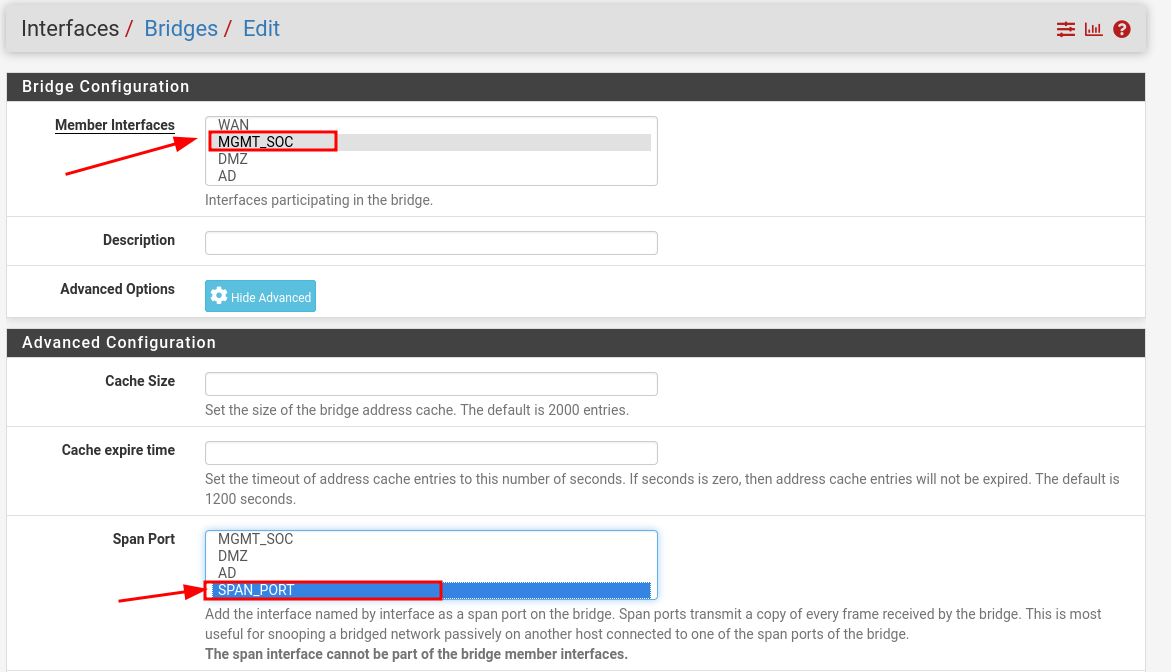
Here we configure port mirroring from the DMZ segment to the SPAN interface. This is critical for monitoring inbound traffic to exposed services and any lateral movement attempts from compromised DMZ hosts.
Create a bridge to mirror DMZ traffic to the SPAN interface
![]()
AD to SPAN
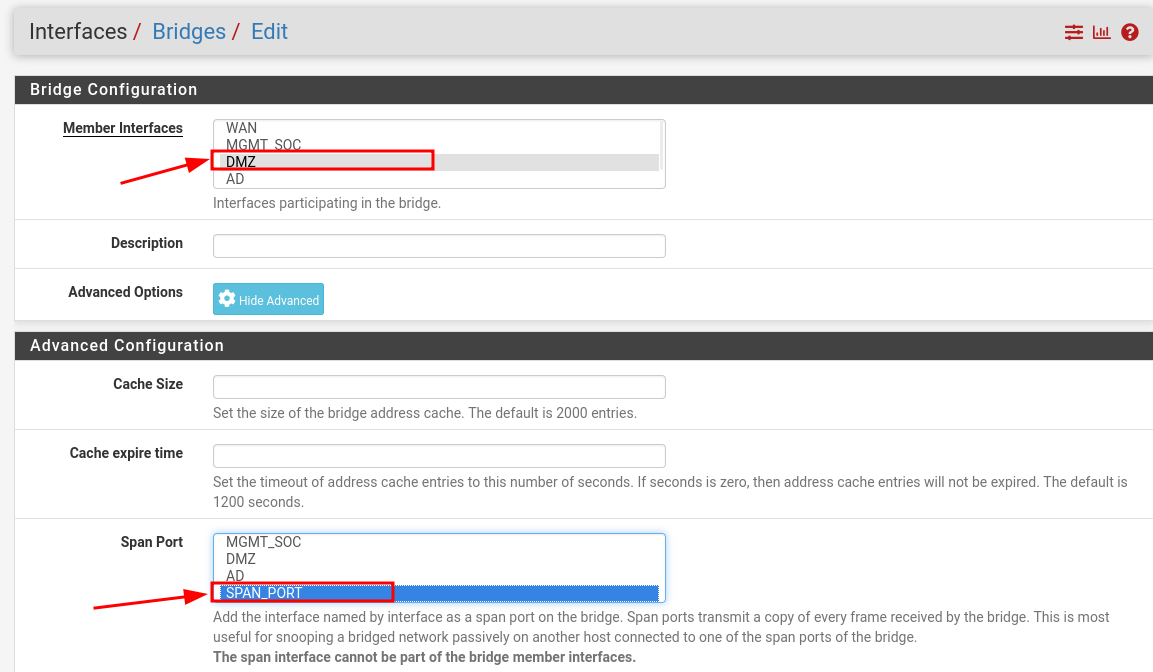
This part covers mirroring traffic from the Active Directory (AD) segment to the SPAN interface. Capturing traffic from AD is essential for detecting attacks targeting domain controllers, Kerberos abuse, or unauthorized lateral movement within the internal network.
Create a bridge to mirror Active Directory (AD) traffic to the SPAN interface
![]()
Desired End State
We aim to have a clear separation of subnets using dedicated VirtualBox bridges, with each subnet's traffic mirrored to the monitoring interface. This architecture ensures full visibility for network inspection tools without mixing traffic between segments.
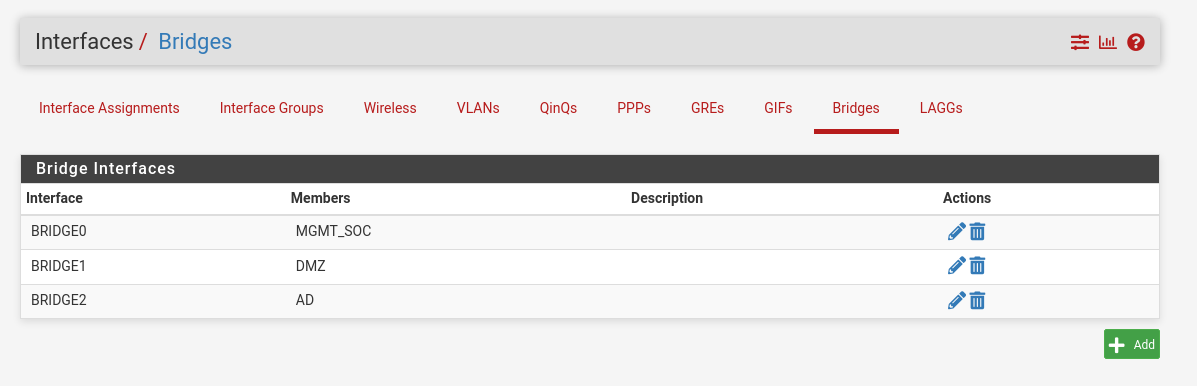
Dedicated bridges per subnet, each with a SPAN port targeting the monitoring interface
Deploying the Wazuh Stack
In this section, we will deploy the Wazuh SIEM using the pre-built OVA (Open Virtual Appliance) provided by the Wazuh team. This will save us from building the SIEM from scratch and ensures that all essential components (Wazuh Manager, Wazuh Dashboard, OpenSearch, etc.) are preconfigured and ready to use in a few clicks.
This setup is intended for lab use only. It is not suitable for production environments due to its lack of high availability or fault tolerance.
Using the Wazuh OVA for Lab Deployment
In this document, we will use version 4.12.0 of the Wazuh OVA image. You can download it from the official documentation: Download Link
This installation method is particularly convenient for VirtualBox users, as the Wazuh team provides a pre-configured virtual machine in .ova format. This VM can be easily imported and is ready for immediate use with minimal setup.
As per the official documentation:
- CPU: 4 cores
- Memory: 8 GB
- Storage: 50 GB
Make sure to adjust based on your own hardware.
Since we are using GOAD, the overall resource demands on your lab environment are significantly higher. Running both GOAD and the Wazuh SIEM simultaneously may strain your system, especially if you're working with limited hardware.
To conserve resources, you may need to temporarily shut down other VMs while using the SIEM stack. Be mindful not to overload your host machine, as this could lead to degraded performance or instability.
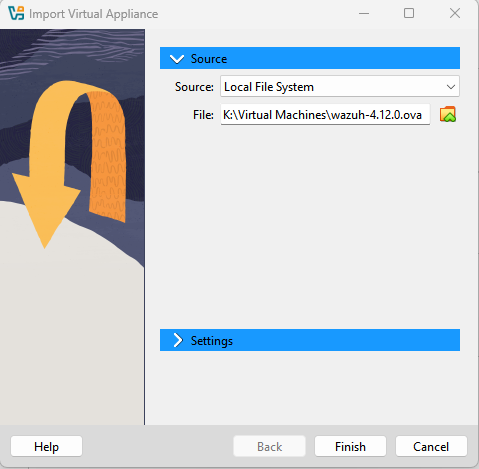
Launch the Wazuh OVA import wizard in VirtualBox
- Double-click the downloaded
.ovafile to launch the VirtualBox import wizard. - Optional : In the wizard, ensure you select "Generate new MAC addresses for all network adapters".
- Click Finish to begin the import process.
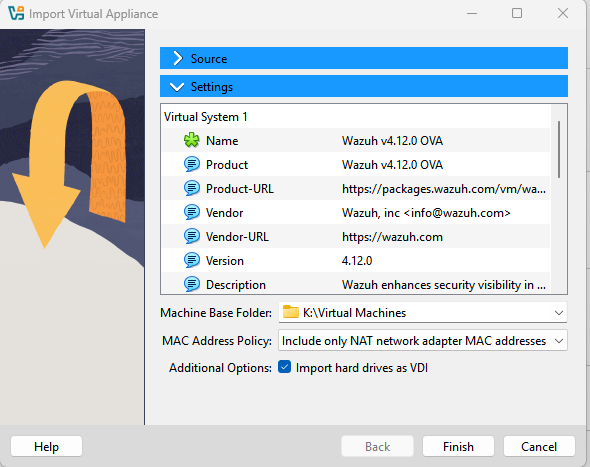
Verify Wazuh OVA settings before importing the virtual appliance

Ensure the Wazuh VM settings include network adapters for both LAN and SPAN
- Adapter 1 must be connected to the
LANand configured to get its IP address via DHCP from pfSense. - Adapter 2 must be connected to the
SPANnetwork, used for traffic capture. Ensure it is set to “Promiscuous Mode: Allow All” to receive mirrored packets.
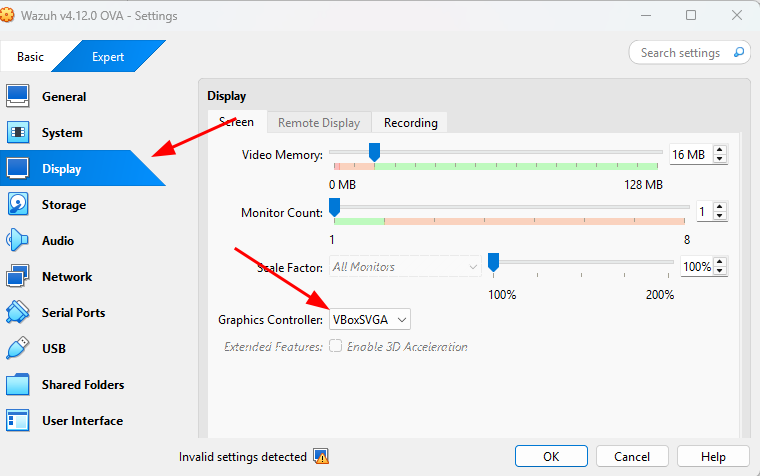
Set Graphics Controller to VBoxSVGA for the VMD to work with GUI
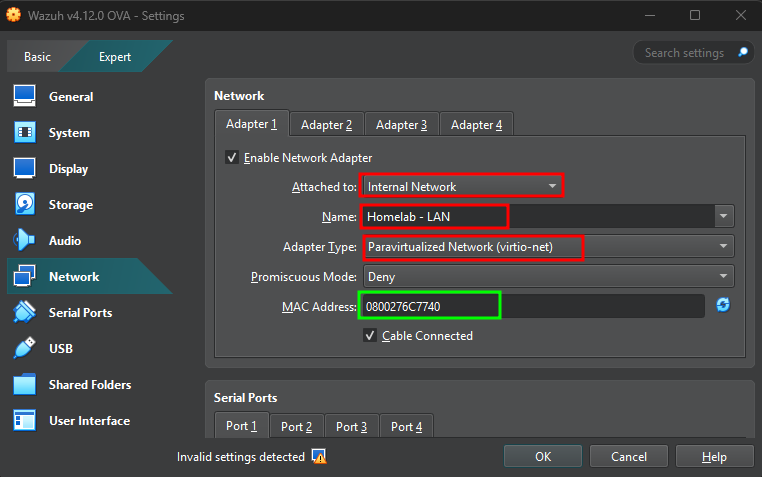
Adapter 1 receives a DHCP address from pfSense's default LAN. Take note of its MAC address, as we’ll soon create a DHCP reservation for it.
Promiscuous mode must be set to 'Allow All' for packet capture on Adapter 2
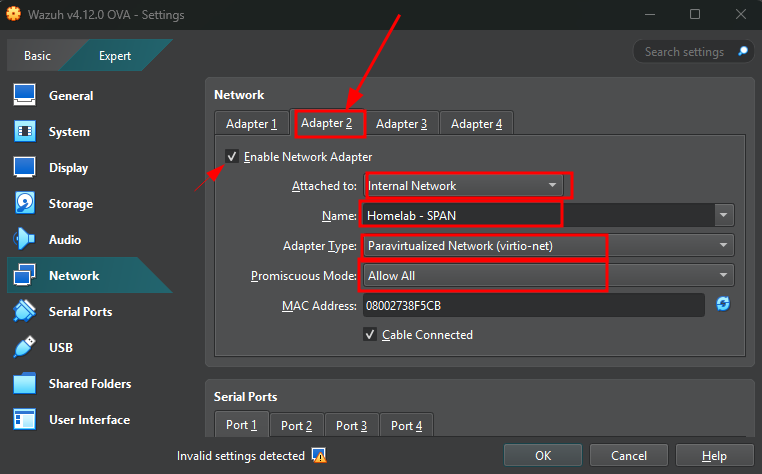
Adapter 2 is connected to the internal network we set up for packet capture. Make sure that 'Promiscuous Mode' is set to 'Allow All'.
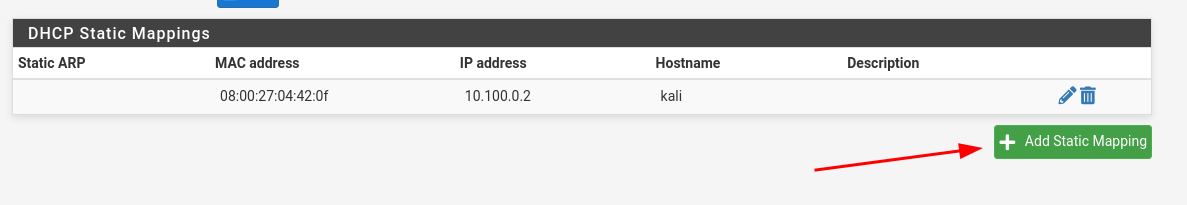
Assign a static DHCP lease to our WAZUH.
As we did previously for Kali (10.100.0.2), we will now assign a static IP to the Wazuh VM’s first adapter (connected to LAN). We'll use 10.100.0.3.
Start by logging into pfSense's Web Interface and navigate to:
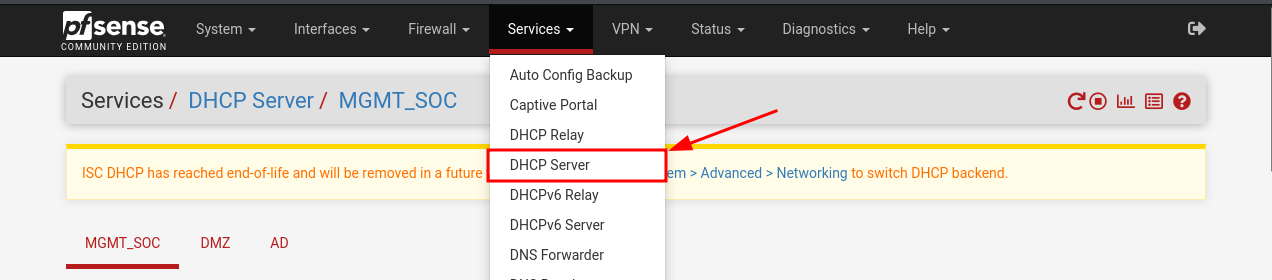
Add a static DHCP lease for the Wazuh VM on pfSense. From Services > DHCP Server > LAN
Set the MAC address and desired IP in the DHCP static mapping configuration
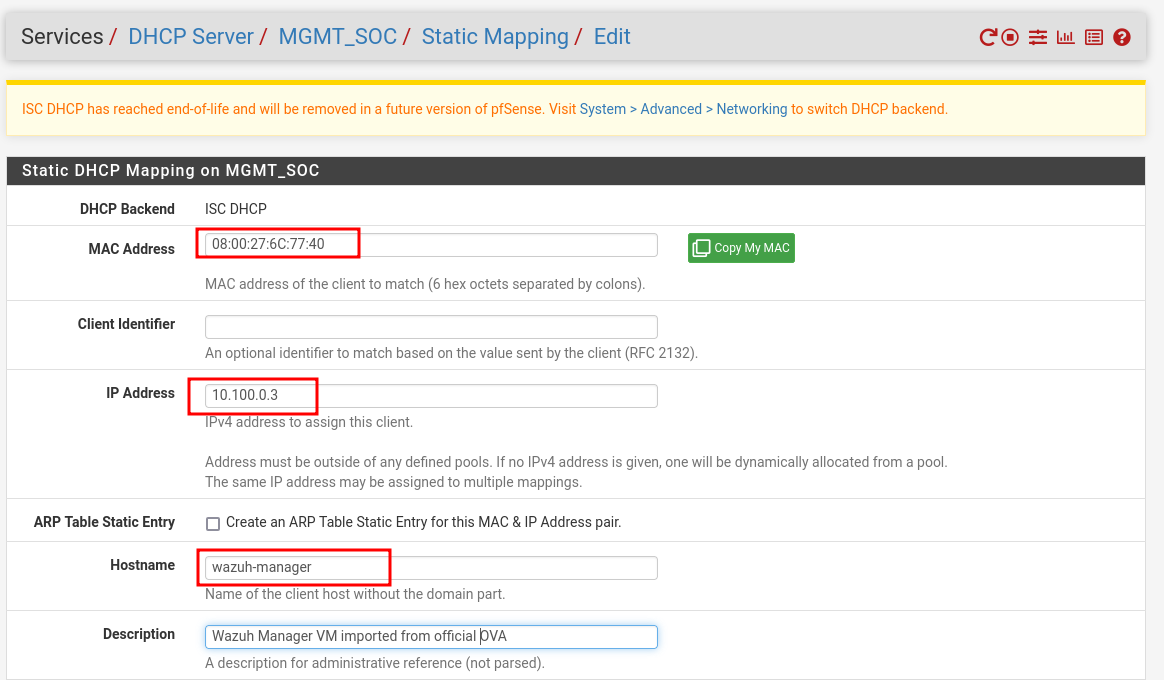
Save and Apply Changes
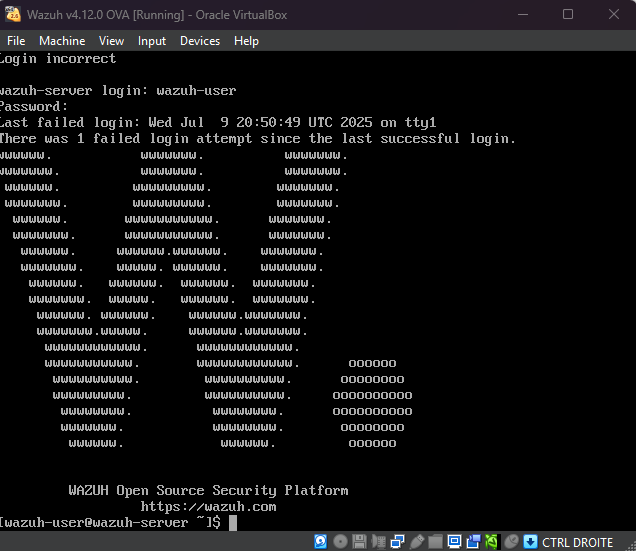
Starting the Wazuh VM
You can now start the Wazuh virtual machine.
Use the following default credentials (according to the official docs):
Username:
wazuh-user
Password:
wazuh
The server runs an Amazon Linux image, based on RedHat Linux, so we'll use the yum package manager for this installation.
Once booted, verify that the VM received the correct IP address (10.100.0.3 from pfSense).
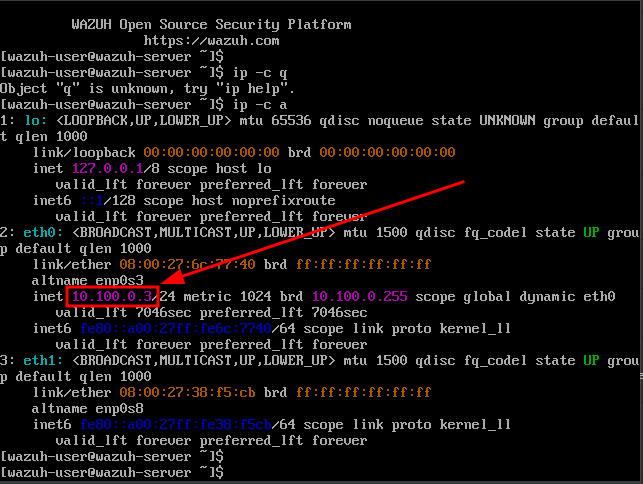
Correctly assigned IP
Access the Wazuh dashboard via web browser using https://10.100.0.3.
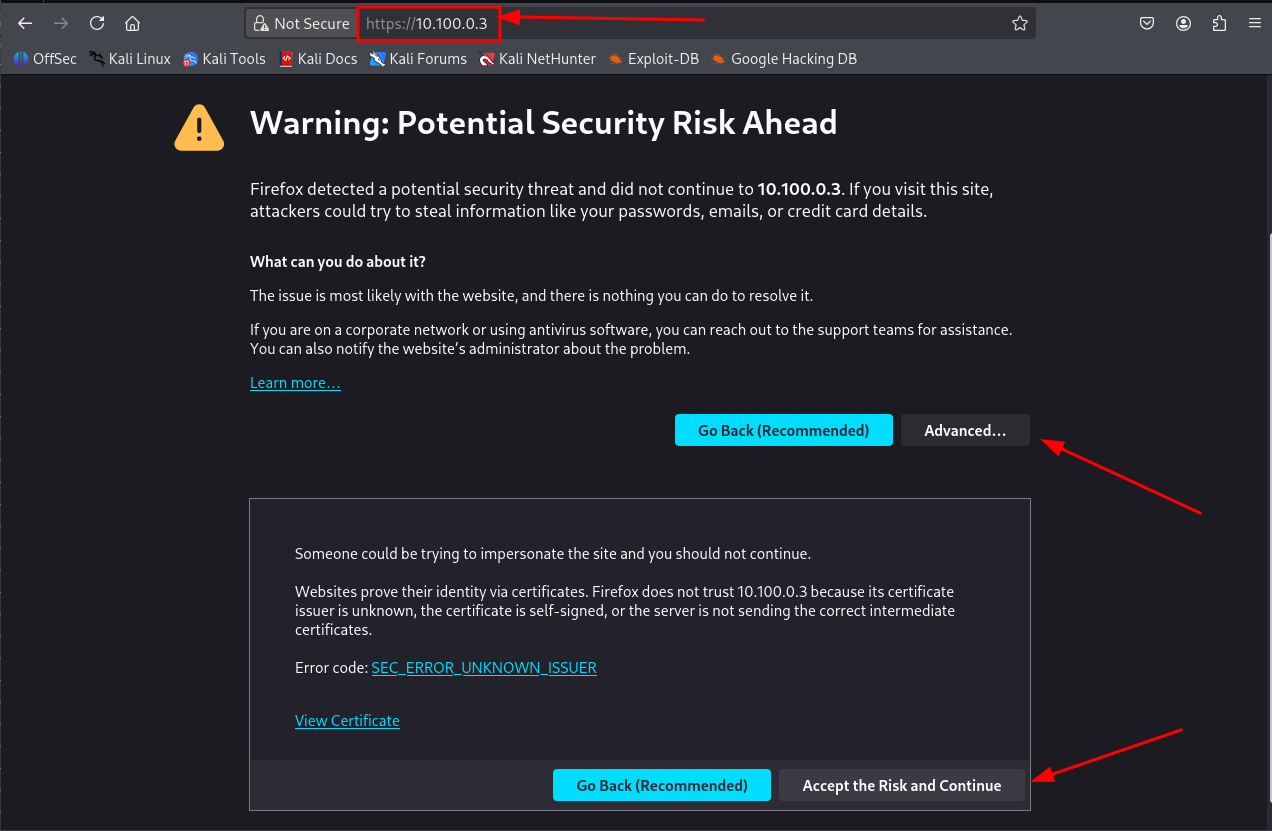
You will likely encounter a self-signed certificate warning — accept it to proceed.
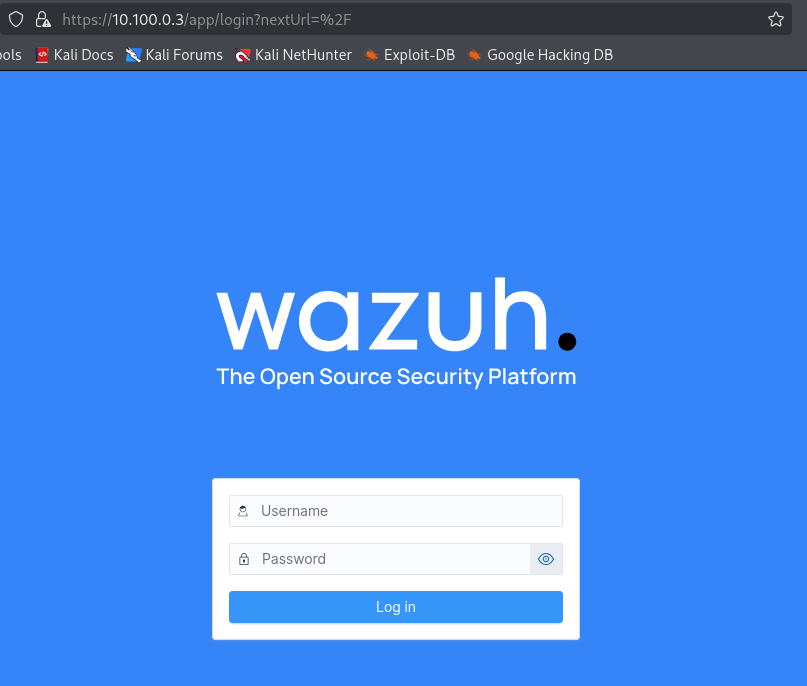
The default login for Wazuh Dashboard
Use the following default credentials (according to the official docs):
Username:
admin
Password:
admin
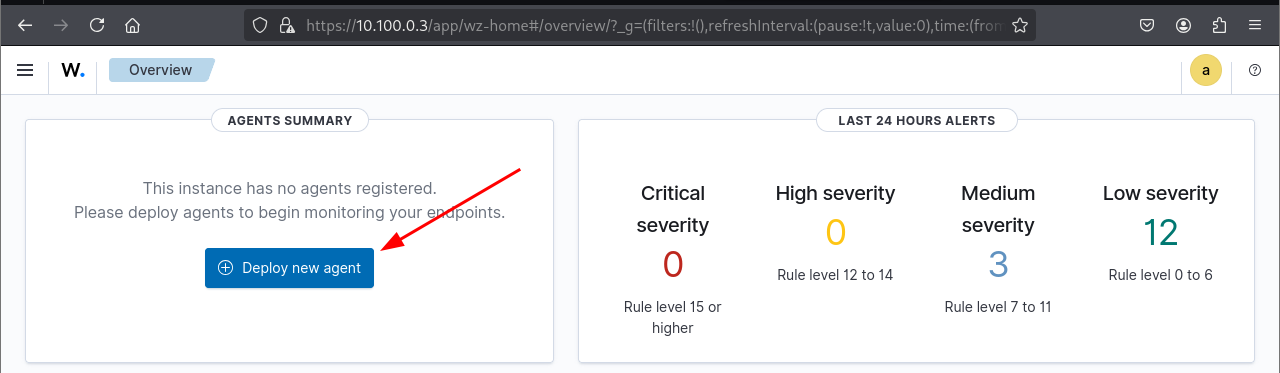
For now, we have no agents (i.e. no endpoints being monitored)
Install the NIDS
To analyze the mirrored traffic from our network segments, we will use Suricata as a Network Intrusion Detection System (NIDS). Before deploying Suricata, we need to make sure our Wazuh VM is ready to capture packets on its SPAN interface (eth1), and that we can manage it remotely from Kali via SSH.
Auto-Raise Capture Interface
We’ll first set up key-based SSH access from our Kali machine to the Wazuh VM for convenience and automation.
- Generate SSH Key Pair If you haven’t already done so on your Kali machine:
ssh-keygen -t rsa -b 4096
This command generates a private key (/.ssh/id_rsa) and a corresponding public key (/.ssh/id_rsa.pub).
- Copy Public Key to the Wazuh Host Now test the SSH login:
ssh-copy-id wazuh-user@10.100.0.3
This will append your public key to the ~/.ssh/authorized_keys file on the Wazuh host, enabling passwordless authentication. (Alternatively, you can manually copy and paste the public key.)
- Login Without Password
ssh wazuh-user@10.100.0.3
If everything went well, you should be logged in without being prompted for a password.
This method is strongly recommended over traditional password-based authentication:
- Stronger Security: Not vulnerable to brute-force attacks.
- No Phishing Risk: No password to steal.
- Automation-Friendly: Ideal for scripts and remote tasks.
- Easier Access Control: Add or remove keys without needing to change passwords.
You can further harden your Wazuh VM by disabling password authentication entirely:
Additionnally, after confirming key-based login works, You can further harden your Wazuh VM by disabling password authentication entirely:
Open the SSH configuration file:
sudo nano /etc/ssh/sshd_config
Set the following directive:
PasswordAuthentication no
Then apply the change:
sudo systemctl restart sshd
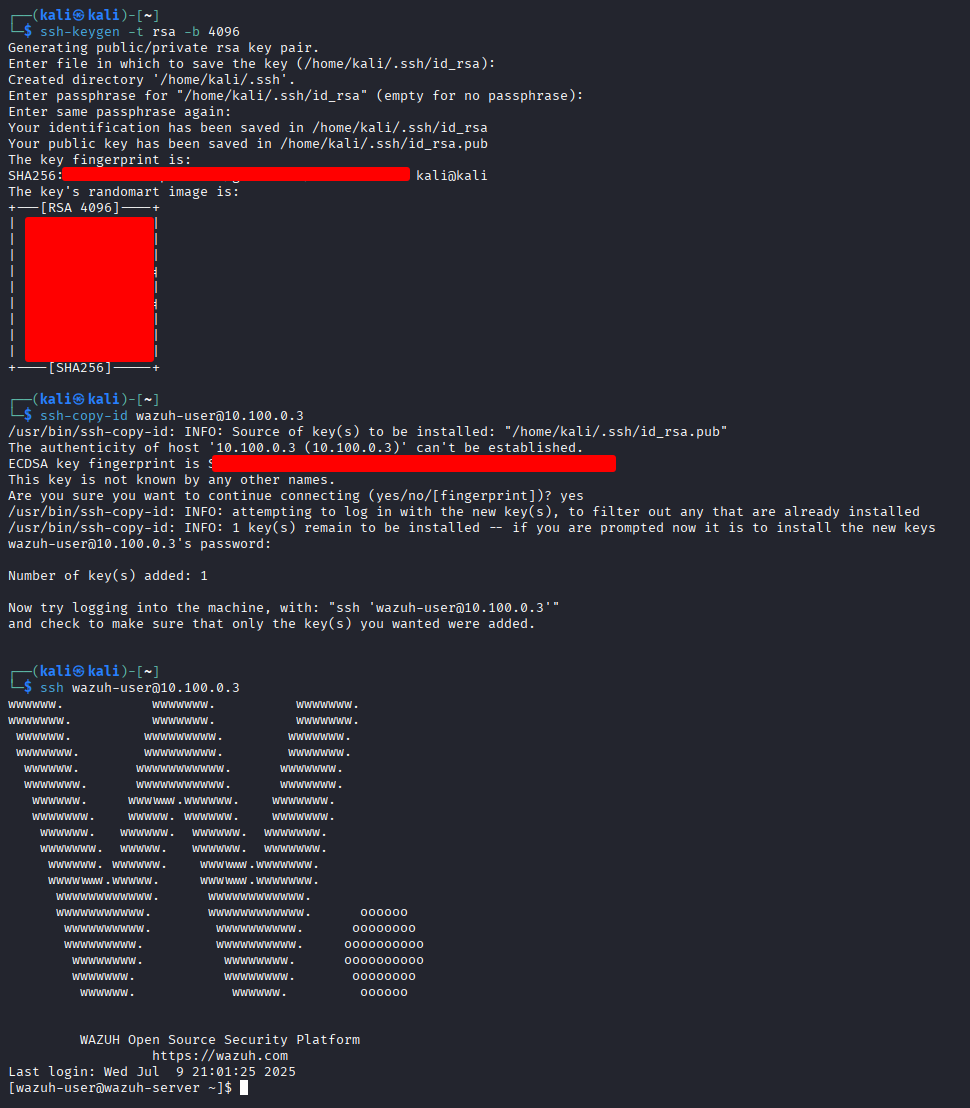
SSH key-based authentication set up from Kali to Wazuh
You can also set a passphrase on your private key for added protection. In this lab, we skipped it for simplicity.
Enable the SPAN Interface (eth1)
By default, the second interface (eth1) used for traffic monitoring does not initialize automatically. We’ll configure it manually to ensure it’s brought up at boot.
Create or edit the configuration file:
sudo nano /etc/sysconfig/network-scripts/ifcfg-eth1
Add the following content:
DEVICE=eth1
ONBOOT=yes
BOOTPROTO=manual
TYPE=Ethernet
NM_CONTROLLED=no
This tells the system to enable eth1 at boot without trying to request an IP address (which is expected for a passive SPAN port).
Packet Capture Test
Let’s now validate that our setup captures mirrored traffic.
In this test:
- On the Kali VM, we will send ICMP (ping) requests to 1.1.1.1.
- On the Wazuh VM, we will use tcpdump to observe the ICMP packets on eth1, which is connected to the SPAN interface.
On Wazuh
sudo tcpdump -ni eth1 host 10.100.0.2 and icmp
On Kali
Ping 1.1.1.1
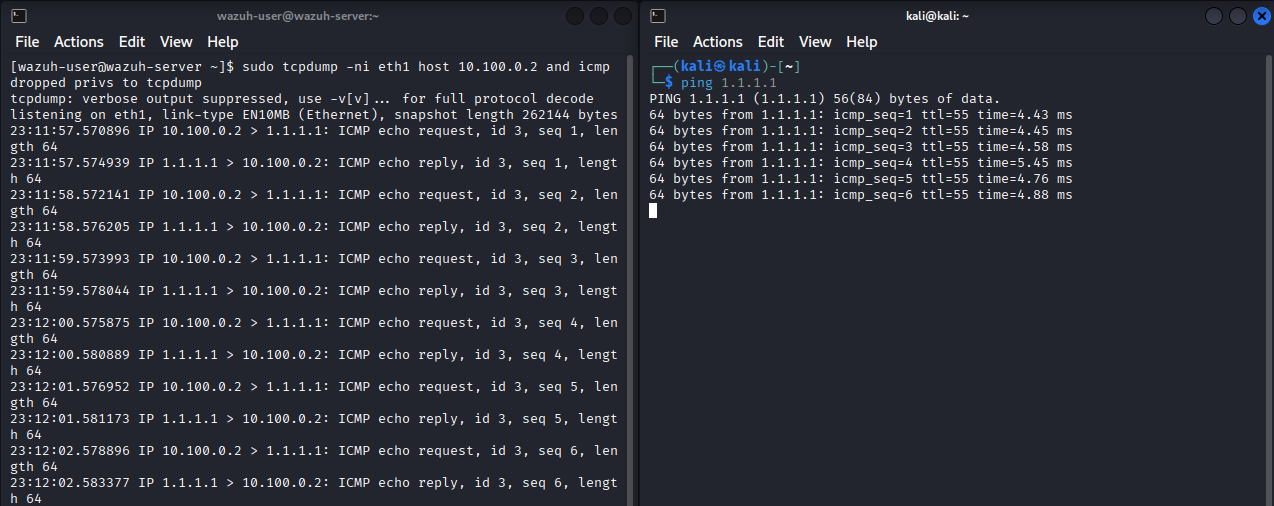
tcpdump on Wazuh showing mirrored ICMP packets from Kali
You should observe the ICMP packets from Kali appearing in the Wazuh terminal.
Explanation
The ping packets sent from Kali (10.100.0.2) to 1.1.1.1 are routed through pfSense.
The bridge0 interface on pfSense mirrors this traffic to the SPAN interface, which is connected to eth1 on the Wazuh VM.
Because eth1 is in promiscuous mode, it can observe all mirrored traffic — including packets not destined to it.
Install Suricata
Suricata can also be installed and used directly on PfSense via the Package manager System > Package Manager > Available Packages, look for suricata. Since we need suricata data to be forwarded to wazuh to be formated parsed and analyzed, we will opt for the default installation directly on the wazuh host. The same can also be done using the Package on PfSense but there would be some manually manipulation.
Reference: Suricata on RHEL 8
We’ll use the steps outlined in the official documentation to install the latest version of Suricata.
sudo yum -y install \
    diffutils \
    file-devel \
    gcc \
    jansson-devel \
    make \
    nss-devel \
    libyaml-devel \
    libcap-ng-devel \
    libpcap-devel \
    pcre-devel \
    pcre2-devel \
    python3 \
    python3-pyyaml \
    rust-toolset \
    zlib-devel \
    python3-pip \
    cronie
Install this pip package, used later to save modification to the suricata.yaml file
sudo pip3 install pyyaml
Download and extract the Suricata source:
cd /tmp
curl -OL https://www.openinfosecfoundation.org/download/suricata-current.tar.gz
tar xvf suricata-current.tar.gz
# Replace x.y.z with the version you got, in time of writing, we are using 8.0.0
cd suricata-x.y.z
Configure the installation:
./configure --prefix=/usr/ --sysconfdir=/etc/ --localstatedir=/var/
Add resources to the wazuh VM before running the next, for me it took way too long with the default resources
This will install Suricata with default configuration files, rules, and utilities :
sudo make install-full
Configure Suricata
Open the main Suricata config file:
sudo nano /etc/suricata/suricata.yaml
Enable JSON output for EVE logs
the suricata.yaml file is used for configuring suricata, Make sure the Extensible Event Format (nicknamed EVE) event log is in JSON format by checking the following values match (Line 98 on this version's 8.0.0 suricata.yaml file, I use nano with the flag -l for line numbering) :
 .
 .
 .
  # Extensible Event Format (nicknamed EVE) event log in JSON format
  98   - eve-log:
  99       enabled: yes
 100       filetype: regular #regular|syslog|unix_dgram|unix_stream|redis
 101       filename: eve.json
 102       # Enable for multi-threaded eve.json output; output files are amended with
 103       # an identifier, e.g., eve.9.json
 104       #threaded: false
 105       # Specify the amount of buffering, in bytes, for
 106       # this output type. The default value 0 means "no
 .
 .
 .
 .
Set capture interface to eth1
(Line 659 on this version's suricata.yaml file) : change interface to eth1
 .
 .
 .
 651 ##
 652 ## Step 3: Configure common capture settings
 653 ##
 654 ## See "Advanced Capture Options" below for more options, including Netmap
 655 ## and PF_RING.
 656 ##
 657
 658 # Linux high speed capture support
 659 af-packet:
 660   - interface: eth1
 661     # Number of receive threads. "auto" uses the number of cores
 662     #threads: auto
 663     # Default clusterid. AF_PACKET will load balance packets based on flow.
 664     cluster-id: 99
 665     # Default AF_PACKET cluster type. AF_PACKET can load balance per flow or per hash.
 666     # This is only supported for Linux kernel > 3.1
 667     # possible value are:
 668     #  * cluster_flow: all packets of a given flow are sent to the same socket
 669     #  * cluster_cpu: all packets treated in kernel by a CPU are sent to the same socket
 670     #  * cluster_qm: all packets linked by network card to a RSS queue are sent to the same
 671     #  socket. Requires at least Linux 3.14.
 .
 .
 .
Update and Enable Rule Sources
sudo suricata-update update-sources
List Suricata rule sources
sudo suricata-update list-sources
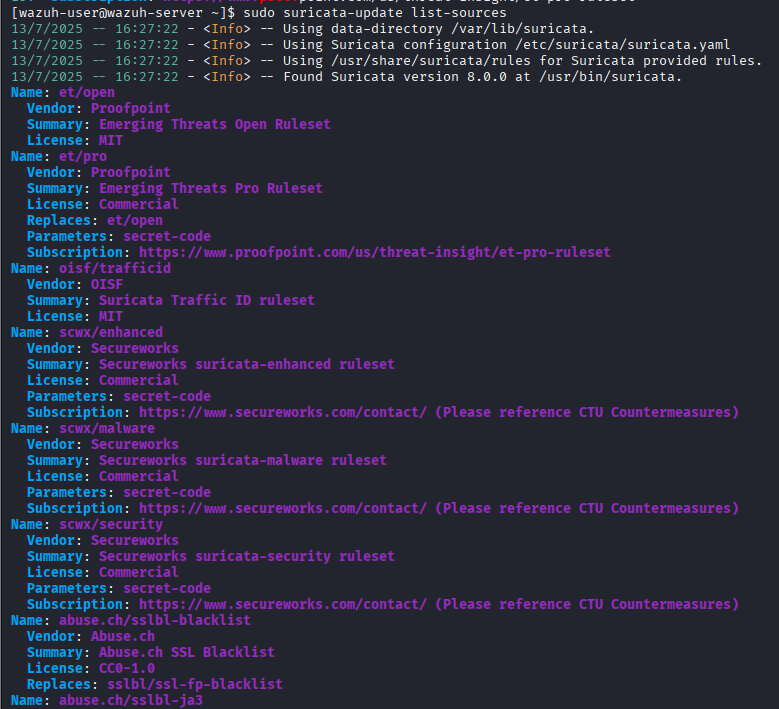
List of available Suricata rulesets retrieved via suricata-update
In the screenshot above, we have a listing of the available rulesets, we can try to install "scwx/enhanced" by Secureworks using the following command
Please note that certain rulesets, like scwx/enhanced, require a subscription key (notice the Subscription value in the rulese's values). Additionally, enabling more rulesets will increase memory usage. This Wazuh virtual machine is allocated 8 GB of RAM by default, you should definetely add more if you can spare the ressources.
To enable a specific ruleset like scwx/enhanced (requires subscription):
sudo suricata-update enable-source scwx/enhanced
sudo suricata-update
Automate Rule Updates with Cron
Edit root’s crontab:
sudo crontab -e
Add the following entry to update Suricata rules daily at 01:00 AM:
0 01 * * * sudo /usr/bin/suricata-update
Create Suricata Systemd Service
sudo touch /etc/systemd/system/suricata.service
sudo chmod 640 /etc/systemd/system/suricata.service
sudo nano /etc/systemd/system/suricata.service
After running the command which suricata we get /usr/bin/suricata, we will specify this value in the ExecStart
sudo nano /etc/systemd/system/suricata.service
Paste the following service file:
[Unit]
Description=Suricata IDS/IPS daemon
After=network.target network-online.target
Requires=network-online.target
Documentation=man:suricata(8) man:suricatasc(8)
Documentation=https://suricata-ids.org/docs/

[Service]
Type=forking
PIDFile=/run/suricata.pid
WorkingDirectory=/etc/suricata

ExecStartPre=/usr/sbin/ldconfig
ExecStart=/usr/bin/suricata -D --af-packet -c /etc/suricata/suricata.yaml --pidfile /run/suricata.pid
ExecReload=/usr/bin/suricatasc -c reload-rules ; /bin/kill -HUP $MAINPID
ExecStop=/usr/bin/suricatasc -c shutdown

Restart=on-failure

# Optional: run as non-root user if configured in suricata.yaml
#User=suricata
#Group=suricata

# Security Hardening
ProtectSystem=full
ProtectHome=true
NoNewPrivileges=true
PrivateTmp=true
ProtectKernelModules=true
ProtectControlGroups=true
ProtectKernelTunables=true
RestrictRealtime=true

# Logging
StandardOutput=journal
StandardError=journal

# Optional Resource Limits
#MemoryLimit=1G
#CPUQuota=80%

# Optional Capabilities if not running as root
#CapabilityBoundingSet=CAP_NET_ADMIN CAP_NET_RAW CAP_SETUID CAP_SETGID
#AmbientCapabilities=CAP_NET_ADMIN CAP_NET_RAW

[Install]
WantedBy=multi-user.target
This systemd service file shows how to apply security hardening, logging, resource limits, and optional capabilities to Suricata. Feel free to adjust these settings to match your security and performance needs.
In case you're managing dynamic libraries manually, uncomment ExecStartPre=/usr/sbin/ldconfig.
Keep in mind that with Suricata now running, the Wazuh VM may experience increased resource usage, especially if you add more rulesets. Monitor system performance using sudo top or sudo htop, and consider adding more CPU or RAM if necessary.
Configure Wazuh Manager
Suricata events are being logged to /var/log/suricata/eve.json. Next, we need to configure the Wazuh Manager to read and ingest logs from this file.
sudo nano /var/ossec/etc/ossec.conf
The <rotate_interval> setting in Wazuh's ossec.conf controls how often log files are rotated—e.g., every day (1d), hour (1h), or week (1w). This helps manage disk usage and keeps log files organized for easier processing. Daily (1d) balances volume and retention needs.
  7 <ossec_config>
  8   <global>
  9     <rotate_interval>1d</rotate_interval>
This block tells Wazuh to monitor Suricata’s eve.json log file in JSON format. It enables Wazuh to ingest and analyze alerts and events generated by Suricata in real time.
#Monitor suricata log file in JSON format
<ossec_config>
  <localfile>
    <log_format>json</log_format>
    <location>/var/log/suricata/eve.json</location>
  </localfile>
</ossec_config>
Log Cleanup
These cron jobs automatically clean up Suricata and Wazuh logs older than 30 days, helping to manage disk space. Add them to the root crontab to run daily at 04:00.
sudo crontab -e
# Daily at 02:00 AM — Delete Suricata log files older than 30 days
0 2 * * * find /var/log/suricata -maxdepth 1 -mtime +30 -type f -exec rm -f {} \; > /dev/null

# Daily at 02:00 AM — Remove Wazuh alert log folders older than 30 days
0 2 * * * find /var/ossec/logs/alerts -type d -mtime +30 -exec rm -rf {} \; > /dev/null 2>&1

# Daily at 02:00 AM — Remove Wazuh archive log folders older than 30 days
0 2 * * * find /var/ossec/logs/archives -type d -mtime +30 -exec rm -rf {} \; > /dev/null 2>&1
Compatibility between the Wazuh agent and the Wazuh manager is guaranteed when the Wazuh manager version is later than or equal to that of the Wazuh agent.
to satisfy this, you can either make sure to update the agent and the manager acoordingly, or disable updates, on the manager that can be achieved by running the following command :
sudo sed -i "s/^enabled=1/enabled=0/" /etc/yum.repos.d/wazuh.repo
Wazuh default rulesets can be extended and personnalized
Installing Wazuh Agents
To allow Wazuh to collect logs from various devices in the lab, we must install agents and ensure proper connectivity. This section covers firewall configuration and agent deployment on Windows systems like those in the GOAD environment
Update pfSense Firewall Rules
To allow machines in the homelab to forward logs to the Wazuh Manager (10.100.0.3), we must configure appropriate firewall rules on pfSense.
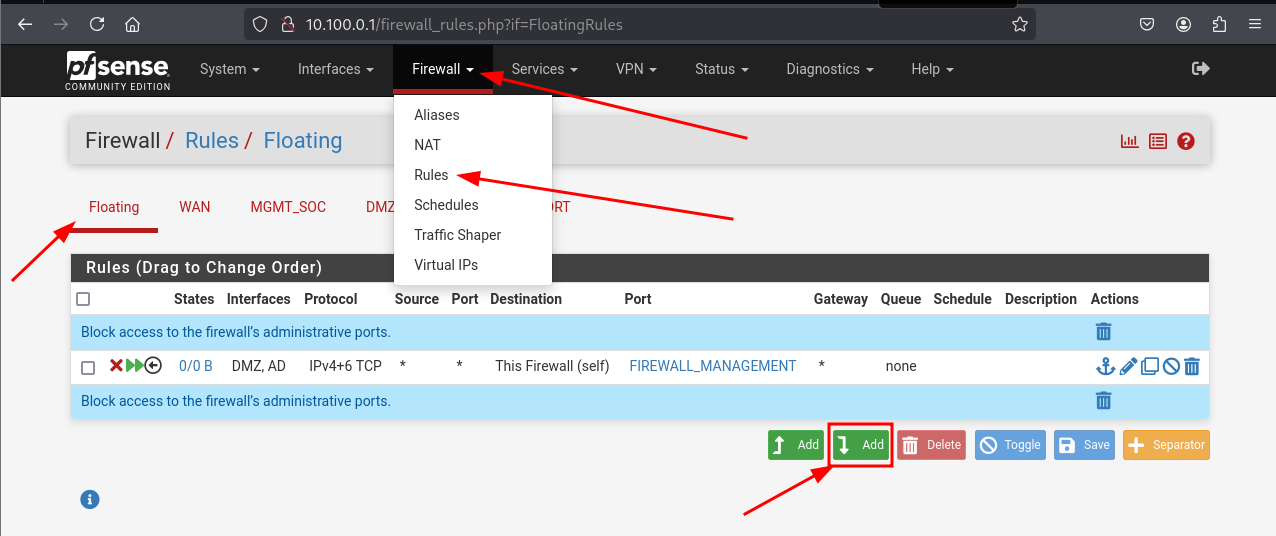
Floating firewall rules in pfSense for forwarding logs to Wazuh
Access the pfSense web interface and go to Firewall > Rules > Floating.
Add a rule to allow traffic from monitored subnets to reach the SIEM
If you add more subnets to your lab in the future, be sure to update this firewall rule to include them, so they can forward logs to the Wazuh Manager.
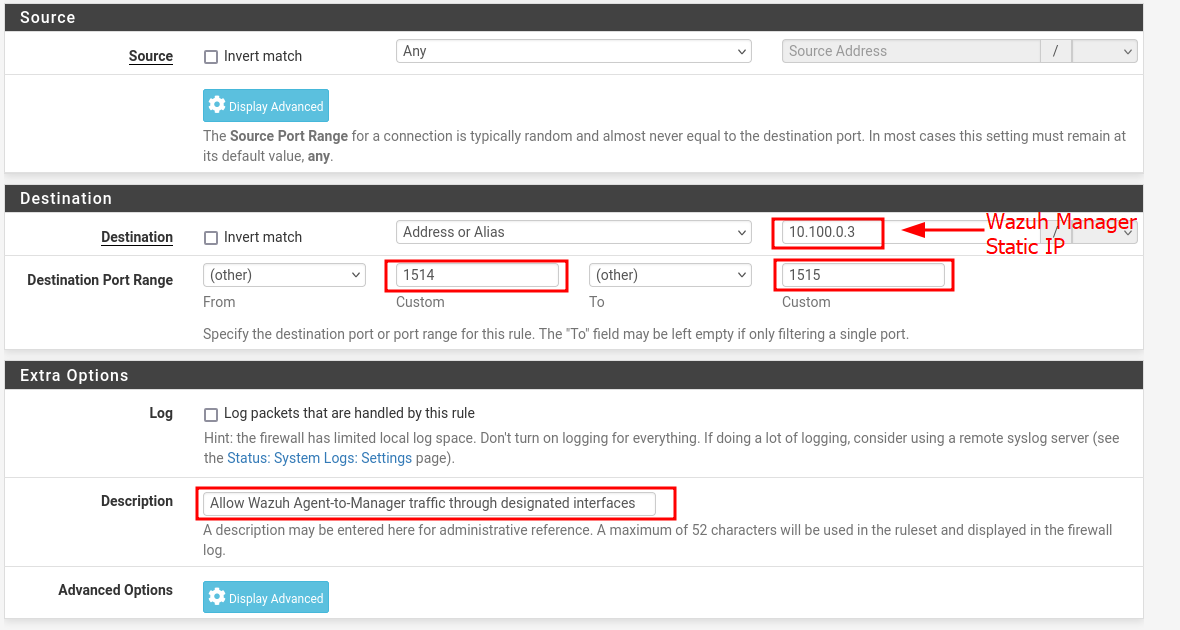
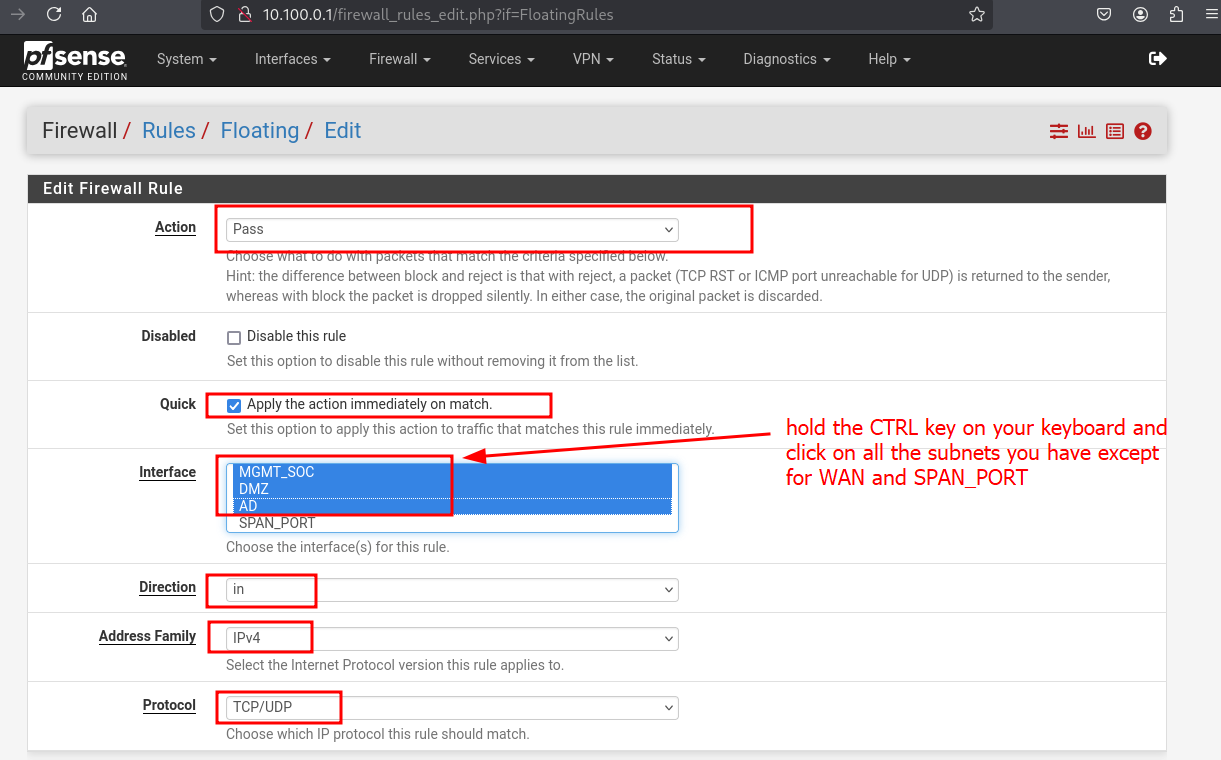
Define source and destination for log-forwarding rule
![]()
Rule added to allow UDP/TCP log traffic to Wazuh Manager
![]()
Complete rule set for Floating firewall with Wazuh logging enabled
Desired state
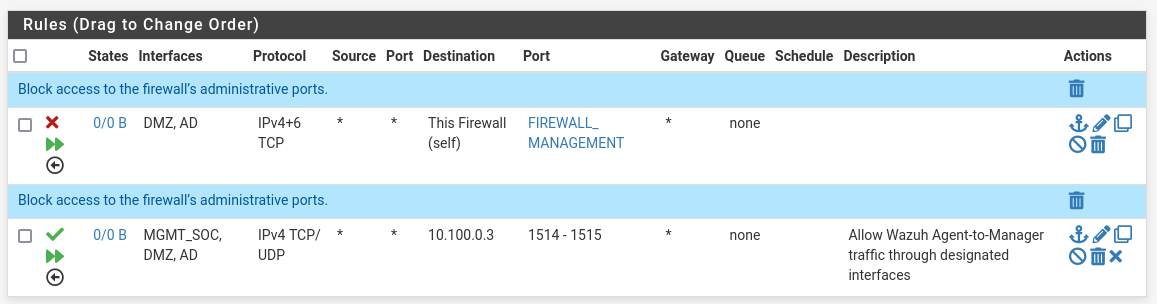
Final desired firewall configuration allowing traffic to SIEM across all subnets
Installing Agents on GOAD
We’ll now install the Wazuh agent on a Windows Server 2019 machine inside GOAD — specifically, GOAD-DC01.
This guide demonstrates the steps on GOAD-DC01, but you can replicate the procedure for all other GOAD systems. You can refer to Wazuh's official documentation for detailed documentation.
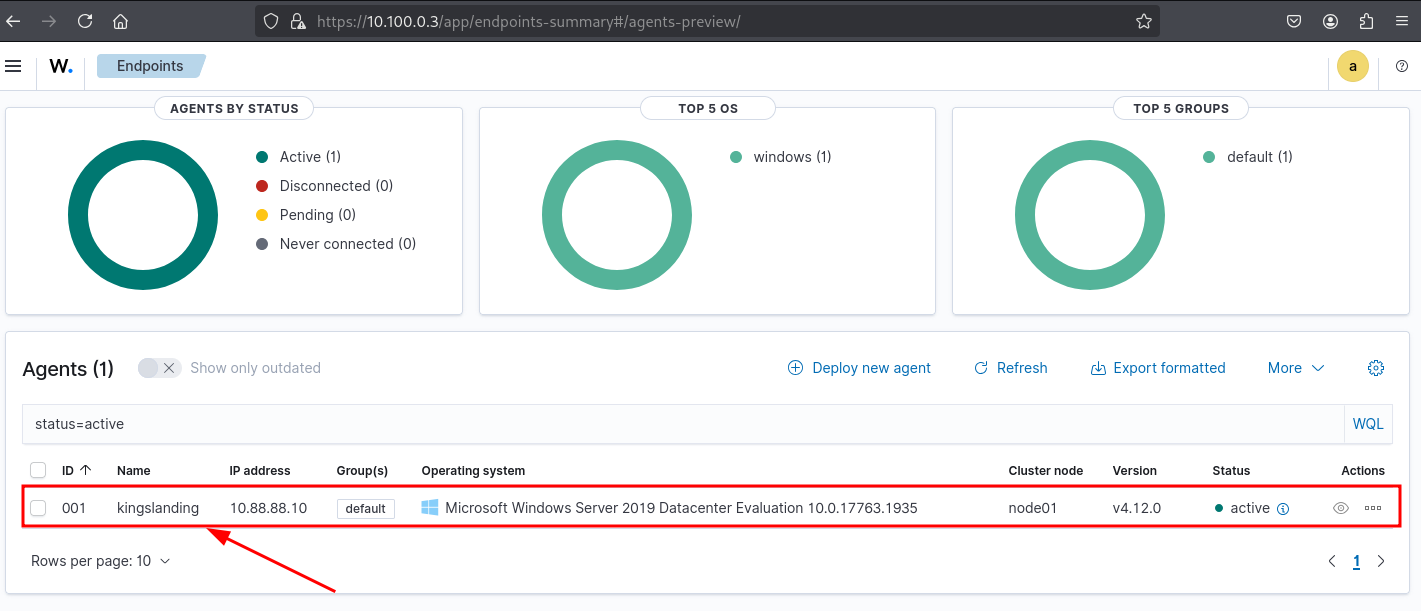
Open the Wazuh dashboard at https://10.100.0.3.
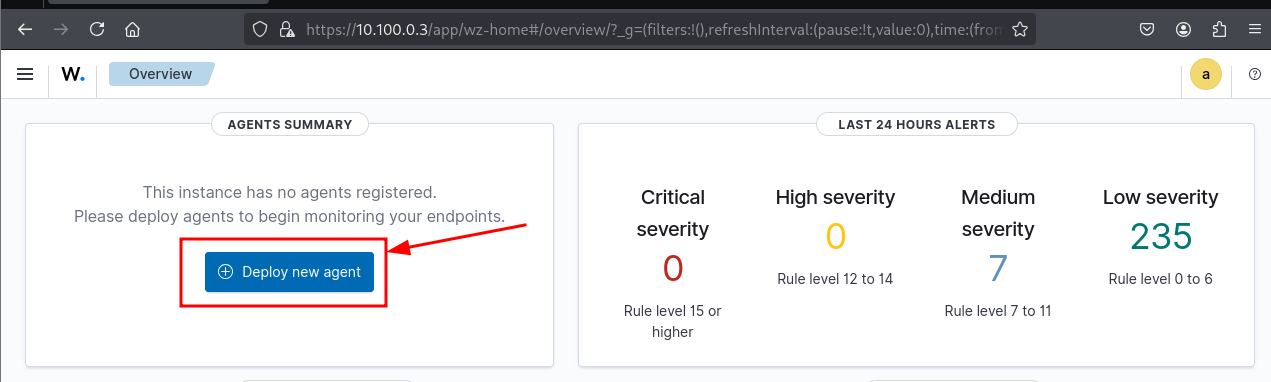
Connect to the Wazuh web dashboard at 10.100.0.3, click Deploy new agent
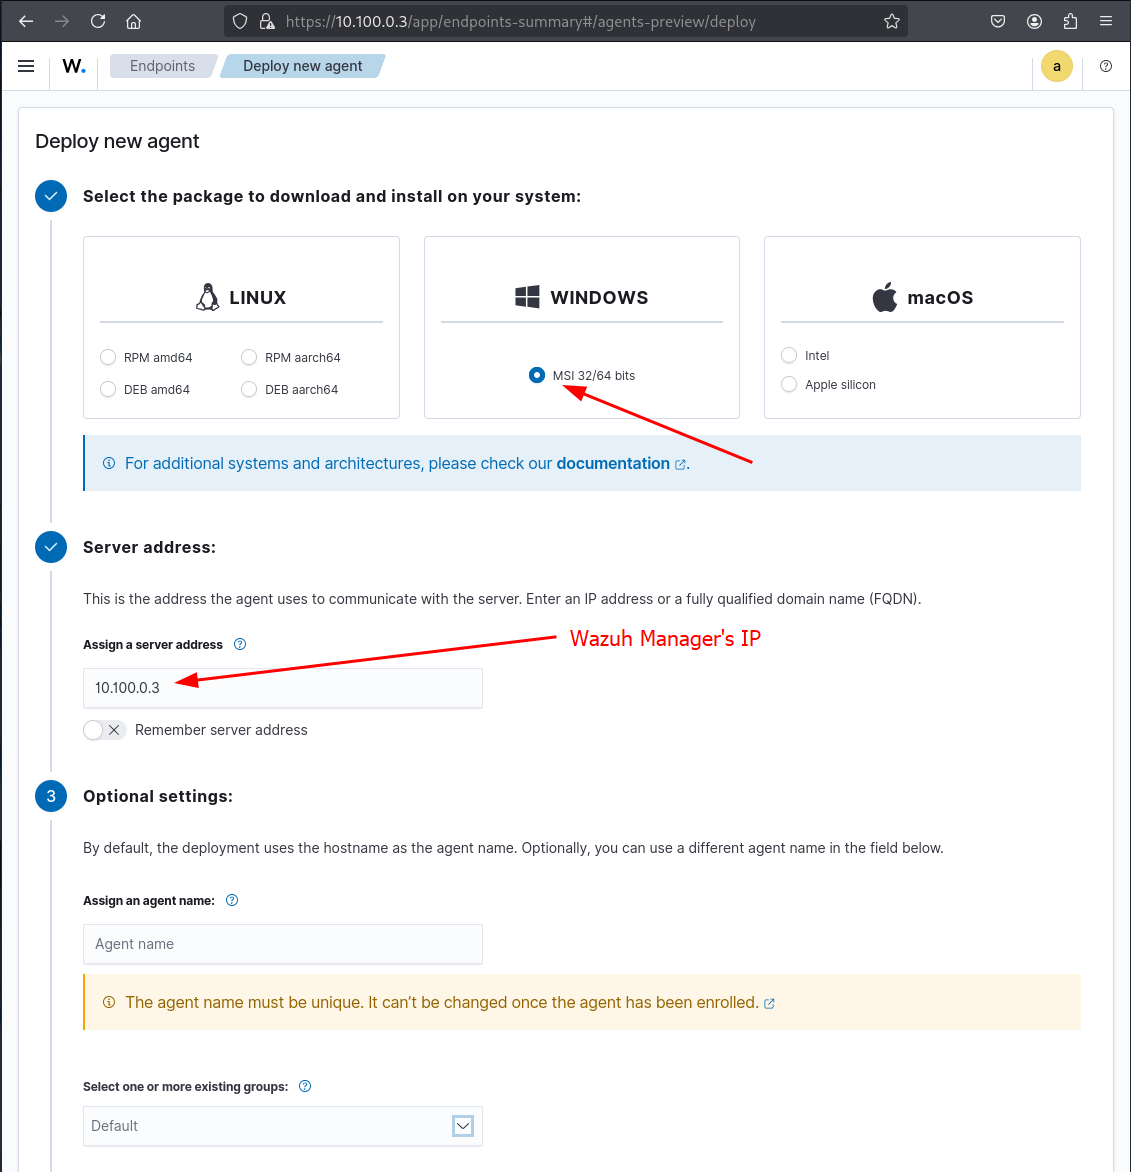
Choose the one for Windows hosts, and set the manager's IP to 10.100.0.3
Start the desired windows VM, we will start by adding an agent to our GOAD-DC01.
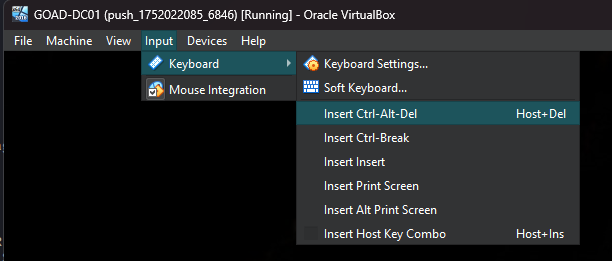
Unlock the GOAD Windows Server VM with Ctrl + Alt + Del
Connect to the vagrant account on GOAD-DC01 with the credentials:
Username:
vagrant
Password:vagrant
After login, head to Network Connections > right click on Ethernet 2 > modify the TCP/IPv4 settings and add 10.88.88.1 as the Default gateway to point to our pfSense router for internet access
Each time you install the agent on a GOAD machine, you need to manually set the default gateway so the VM can reach the Wazuh Manager (and the internet, if needed).
Example for GOAD-DC01:
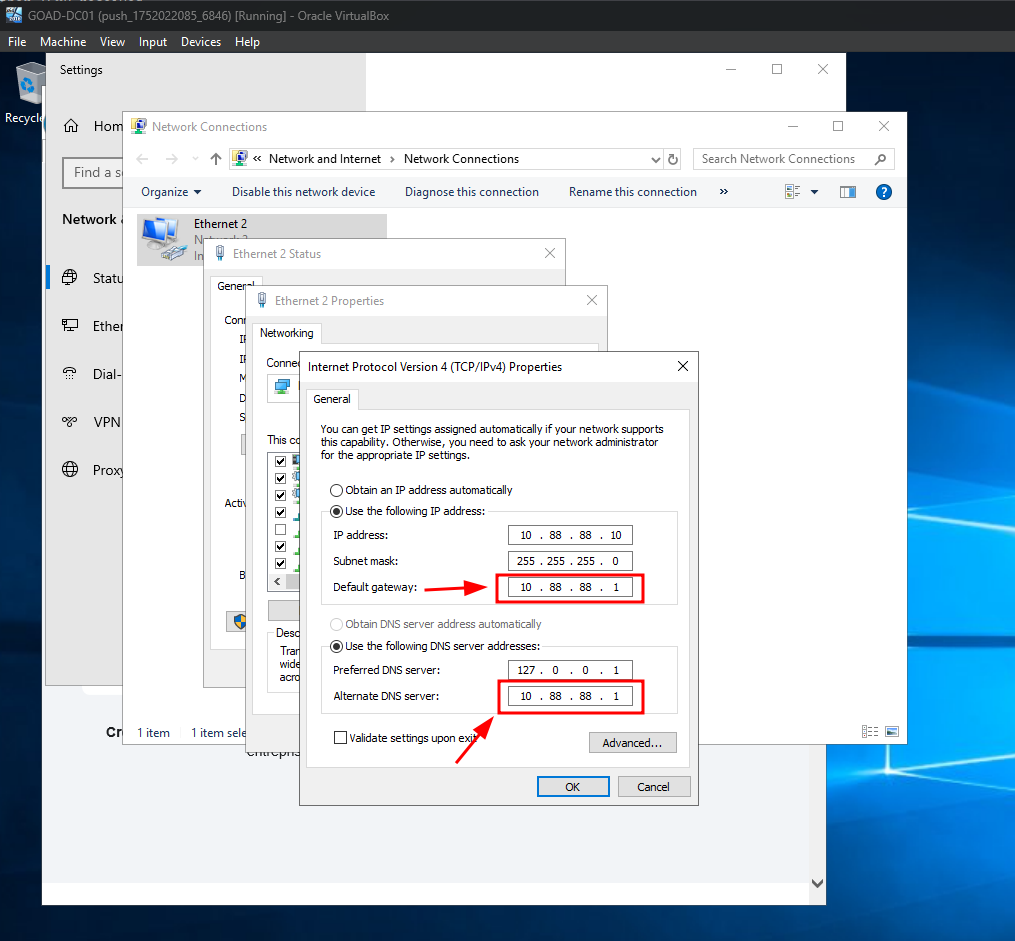
Add gateway and DNS settings to support internet connectivity for GOAD
Repeat this operation for every GOAD VM on which you want to install the agent.
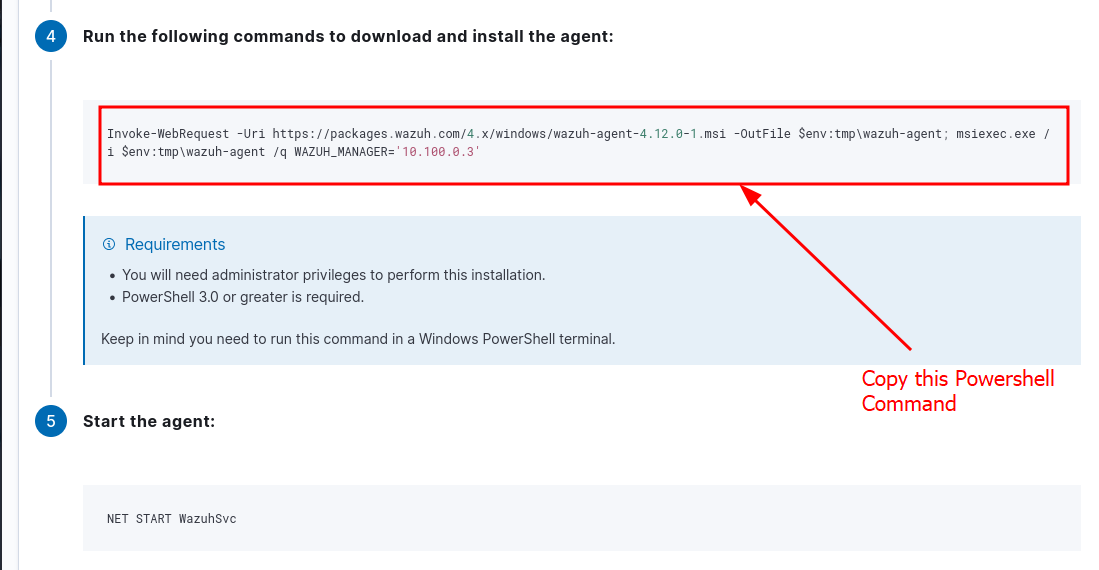
Use the following PowerShell command on the Windows VM to download and silently install the Wazuh agent:
Invoke-WebRequest -Uri https://packages.wazuh.com/4.x/windows/wazuh-agent-4.12.0-1.msi -OutFile $env:tmp\wazuh-agent; msiexec.exe /i $env:tmp\wazuh-agent /q WAZUH_MANAGER='10.100.0.3'
Then start the agent using :
NET START WazuhSvc
The network configuration applied here sets the default gateway to 10.88.88.1, which routes all outbound traffic through the pfSense firewall. This enables the VM to access the internet via pfSense’s NAT and filtering capabilities.
The Preferred DNS server is left unchanged to preserve correct internal name resolution within the GOAD Active Directory lab. This ensures seamless communication between domain controllers (DCs), member servers, and across trust boundaries between domains.
The Alternate DNS server is set to 10.88.88.1, allowing the pfSense DNS resolver to handle external DNS queries if internal AD DNS servers are unreachable or cannot resolve internet domains. This provides internet name resolution while preserving internal AD functionality.
You can add firewall rules to your liking if you don't want internet access, or configure a proxy (e.g., Squid on PfSense) to control and inspect outbound connections
Verifying Agent and Suricata Integration in Wazuh
Once the agent is installed and the machine is connected to the Wazuh Manager, you can begin monitoring logs and alerts from both the endpoint and Suricata.
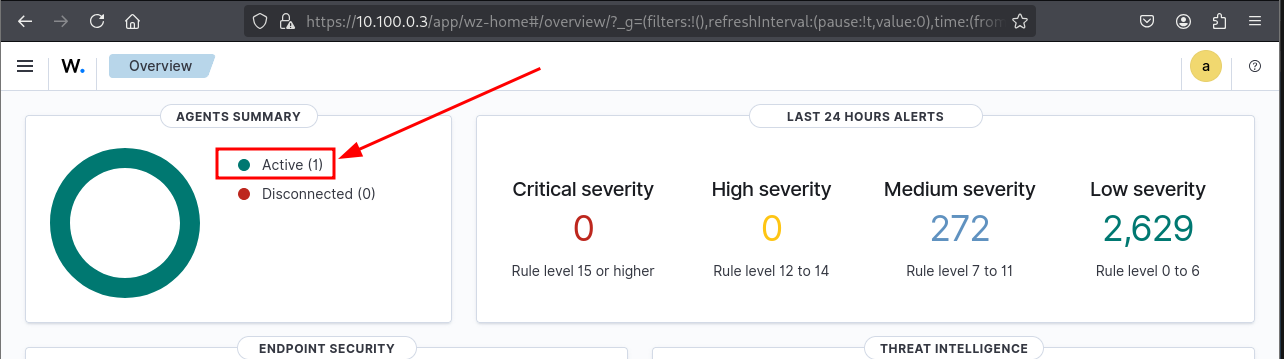
Verify that the agent is connected
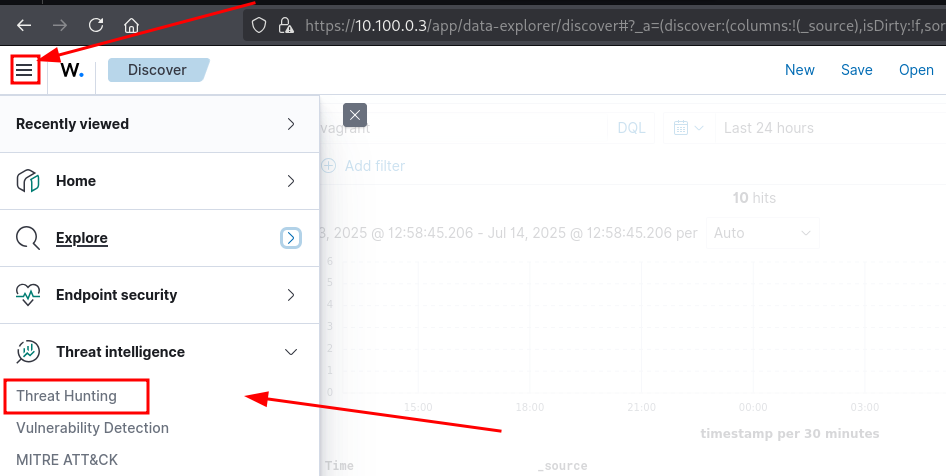
Head to the Threat Hunting dashboard and inspect agent events
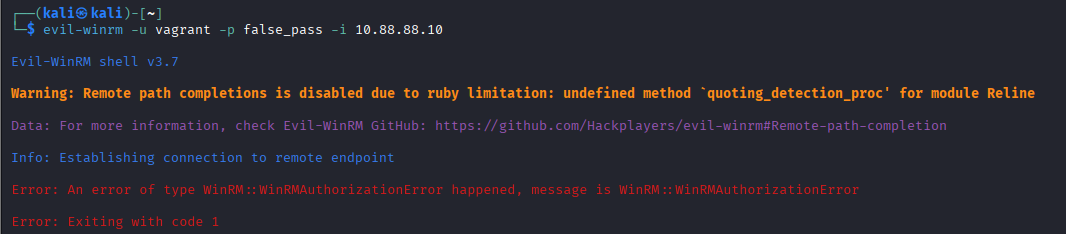
Try to connected to GOAD-DC01 using rejected credentials to create authentication failure reports on wazuh
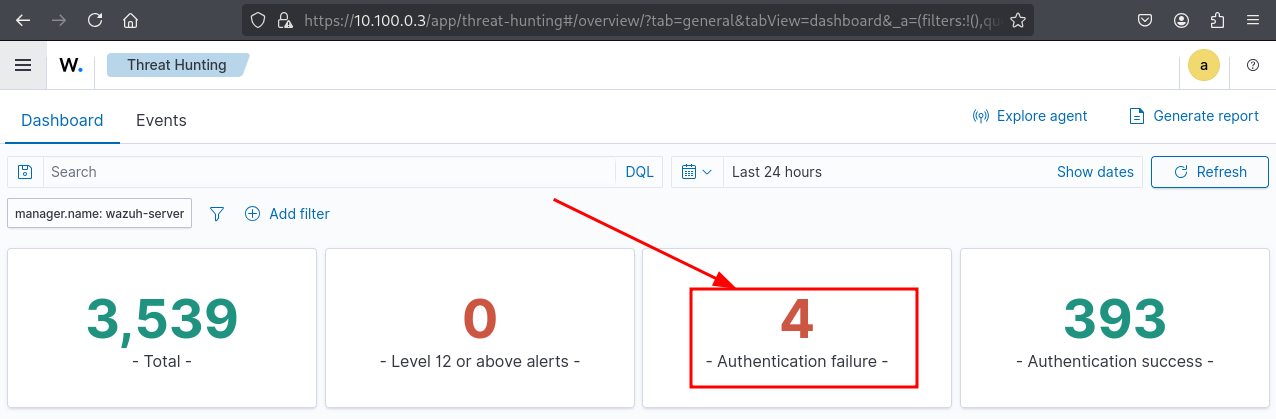
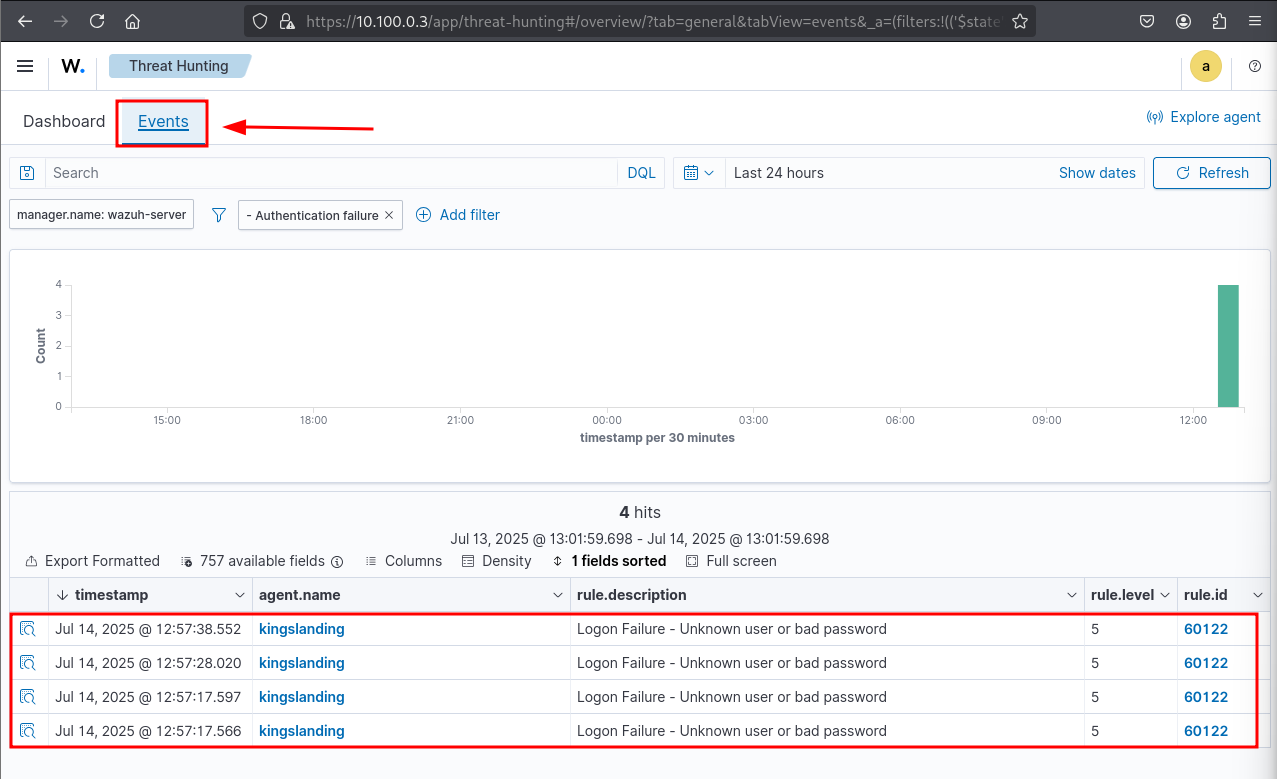
Event logs showing our auth failure
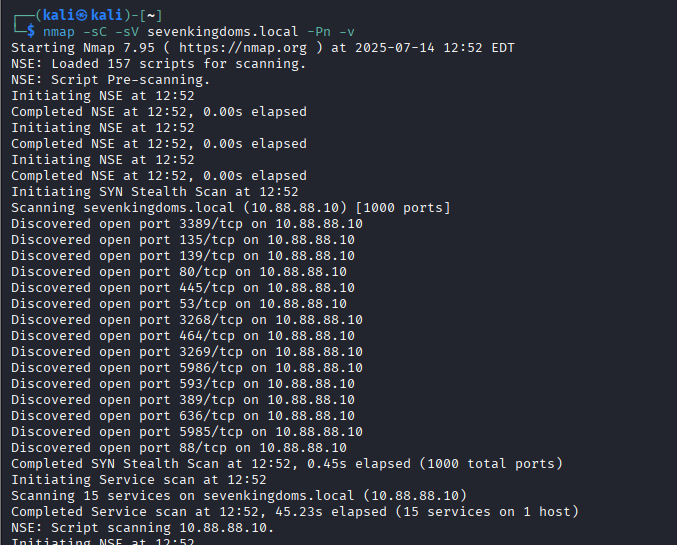
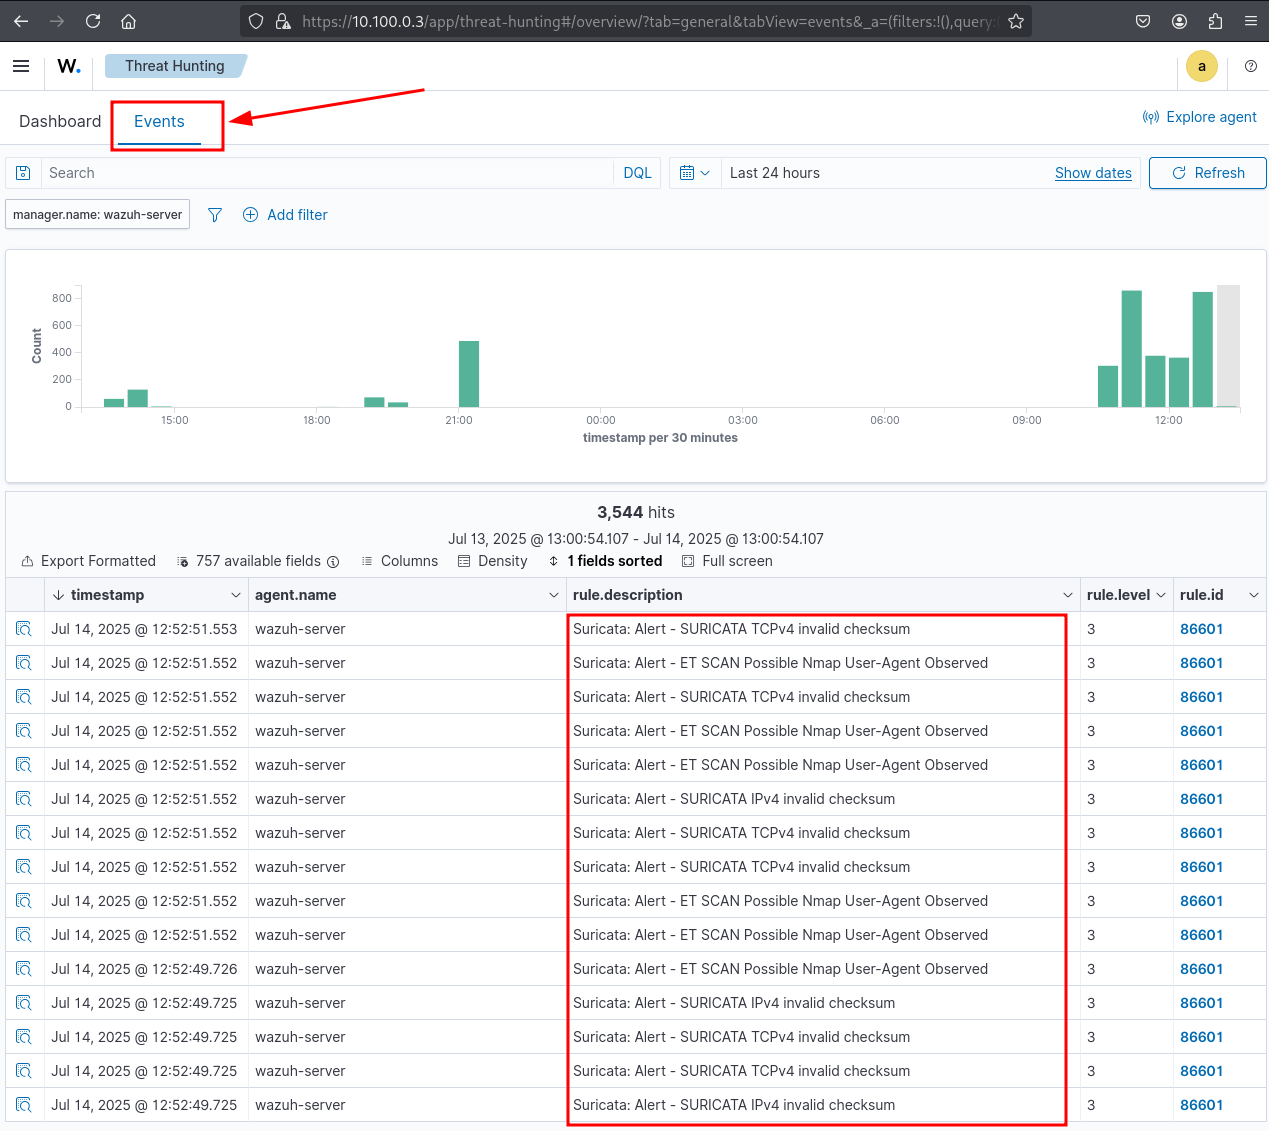
Confirm Suricata ruleset has triggered detection logs using an nmap scan
Looking through the events, we can see our custom or downloaded Suricata rulesets in action.
Example Suricata alert from the ruleset inside Wazuh
Optional : Set up Sysmon on GOAD VMs
Installing Sysmon enhances visibility into endpoint activity within the GOAD domain. This allows Wazuh to correlate system-level events like process creation and network activity with network-based alerts (e.g., from Suricata), strengthening detection capabilities Without Sysmon, endpoint telemetry is minimal and lacks the depth needed for meaningful detection and correlation.
What is Sysmon ?
Sysmon (System Monitor) is a Windows system service and driver from Microsoft (part of the Sysinternals suite) that logs detailed information about system activity into the Windows Event Log. It’s primarily used for security monitoring, threat hunting, and forensics.
Once installed and configured, Sysmon can record:
- Process creation (including command-line arguments, hashes, parent process)
- Network connections made by processes
- File creation timestamps
- Driver loading
- Registry modifications
- Named pipe creation
- DNS queries
- Image loading
- Clipboard monitoring
- And more… All of these events go into the Windows Event Log, under the Microsoft-Windows-Sysmon/Operational channel.
Head to : https://learn.microsoft.com/en-us/sysinternals/downloads/sysmon
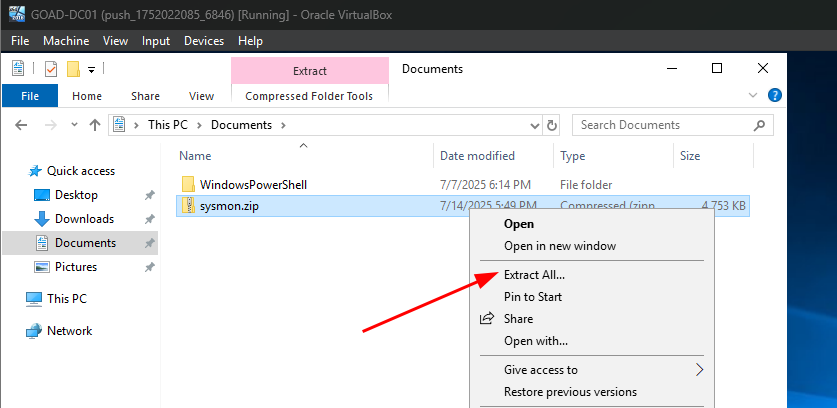
You can download it directly on the Windows VMs, or from another host and copy it to there if you don't want to have internet on AD subnets
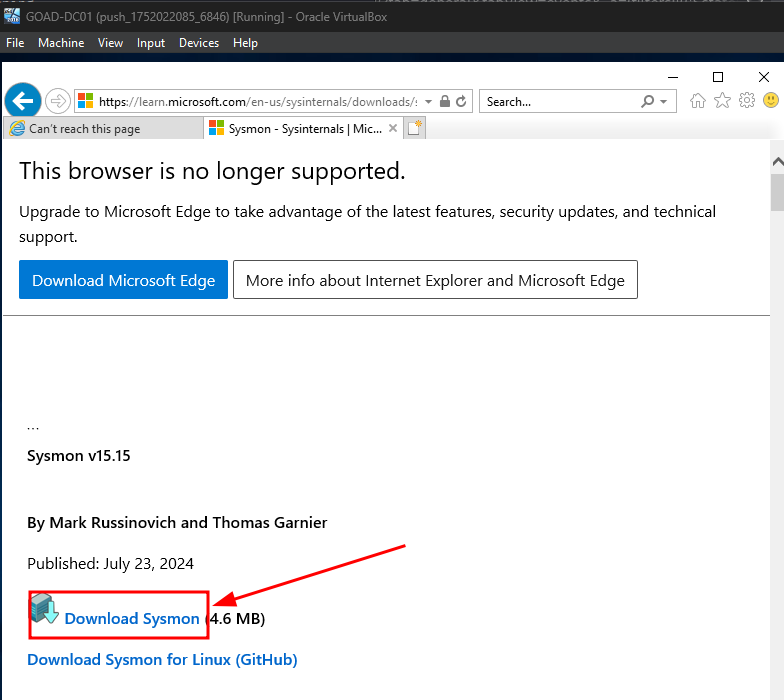
Sysmon.zip downloaded and ready to be extracted for deployment
Or use this powershell
Invoke-WebRequest -Uri "https://download.sysinternals.com/files/Sysmon.zip" -OutFile "Sysmon.zip"
Sysmon binary and configuration extracted to C:\Tools\Sysmon
What is a Sysmon configuration file?
A Sysmon configuration file is an XML file that tells Sysmon which events to monitor and how to filter them. It controls what data gets logged to avoid noise and focus on meaningful security events.
A config file typically defines:
- Which event types to include (e.g., process creation, DNS queries, registry changes)
- Filters to log only relevant events (e.g., specific processes or paths)
- Rules for inclusion or exclusion
Using a good configuration improves performance, reduces log volume, and ensures compatibility with detection tools like Wazuh or SIEMs.
Well-known examples include:
- sysmon-modular by Olaf Hartong (modular and customizable)
- SwiftOnSecurity’s config (easy to deploy and general-purpose)
Example structure in a sysmon xml configuration file :
<RuleGroup name="ProcessCreate" groupRelation="or">
    <ProcessCreate onmatch="include">
        <Image condition="contains">powershell.exe</Image>
    </ProcessCreate>
</RuleGroup>
Are they Optional?
Technically yes, but practically no:
- Without them, Sysmon logs a default (very limited) set of events. It’s not very useful.
- With them, you gain fine-grained control over what Sysmon monitors and logs, which is essential for performance and relevance.
If you run Sysmon without a configuration:
Sysmon.exe -i
…it installs with default behavior, which may generate excessive or irrelevant logs.
So, to make Sysmon useful and manageable, a ruleset is strongly recommended.
Using Sysmon with Wazuh
Get a Good Sysmon Configuration File
There's multiple community-maintained configs used to get relevant, clean, structured logs, the most popular and interesting from a cybersecurity point of view are SwiftOnSecurity/sysmon-config, or a more alert-oriented one called olafhartong/sysmon-modular. We will use olaf hartong's for the following instructions (which is also the one referenced on wazuh's official documentation).
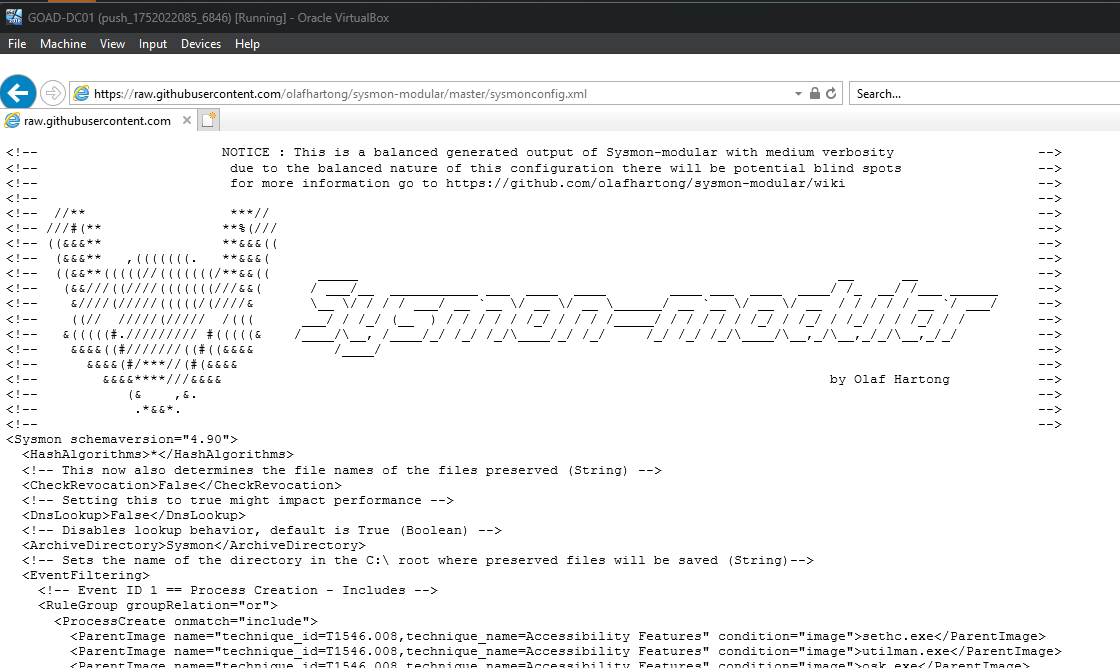
Get a curated Sysmon configuration file for relevant event logging
You can either copy the content (CTRL + A to select everything, CRTL + C to copy to clipboard) and paste it on a Notepad, then save it as sysmonconfig.xml, or use the following powershell command
Invoke-WebRequest -Uri "https://raw.githubusercontent.com/olafhartong/sysmon-modular/master/sysmonconfig.xml" -OutFile "sysmonconfig.xml"
Install Sysmon with the Config
Run as Administrator in PowerShell or CMD: Navigate to the directory where you downloaded and Extracted sysmon, mine was on vagrant's Documents
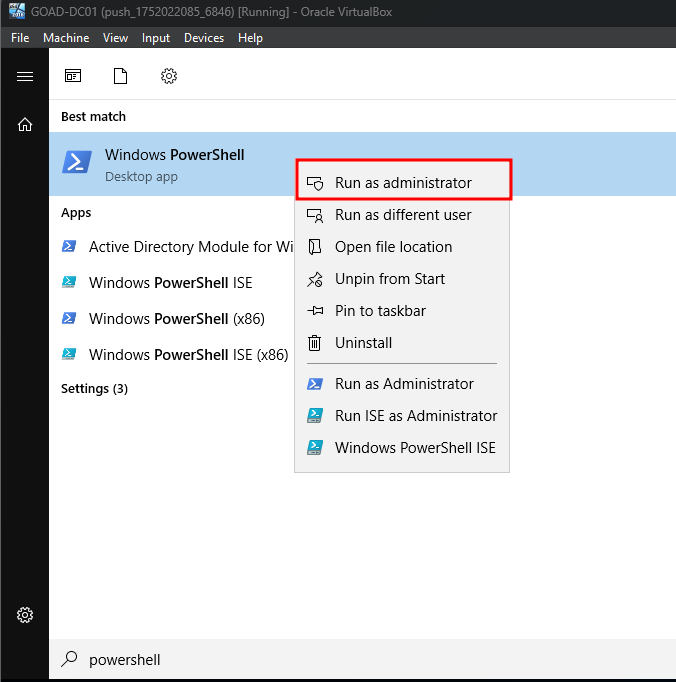
Navigate to Sysmon directory and prepare to install with the config
Make sure to run this from an elevated PowerShell (Run as Administrator), or the driver won't install.
cd C:\Tools\Sysmon
.\Sysmon64.exe -accepteula -i .\sysmonconfig.xml
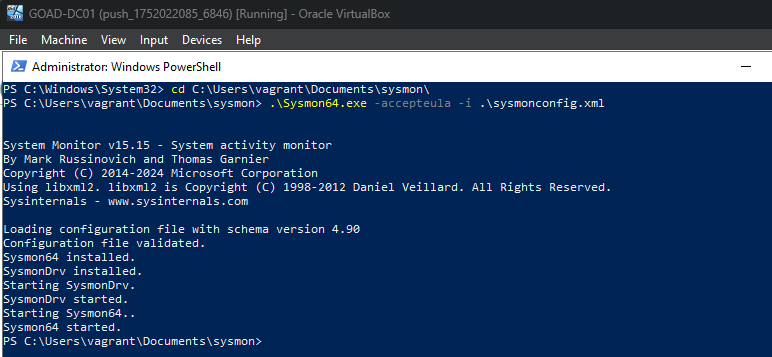
Sysmon installed with olafhartong's modular config
You can check it's running:
Get-Process sysmon

Verify that Sysmon is running using PowerShell
Confirm Logs Are Flowing to Wazuh
Confirm Sysmon Events in Windows' Event Viewer
-
Open Event Viewer (eventvwr.msc) ➝
Applications and Services Logs➝Microsoft➝Windows➝Sysmon➝Operational -
You should see Event IDs like:
- 1: Process Create
- 3: Network connection
- 11: File creation, etc.
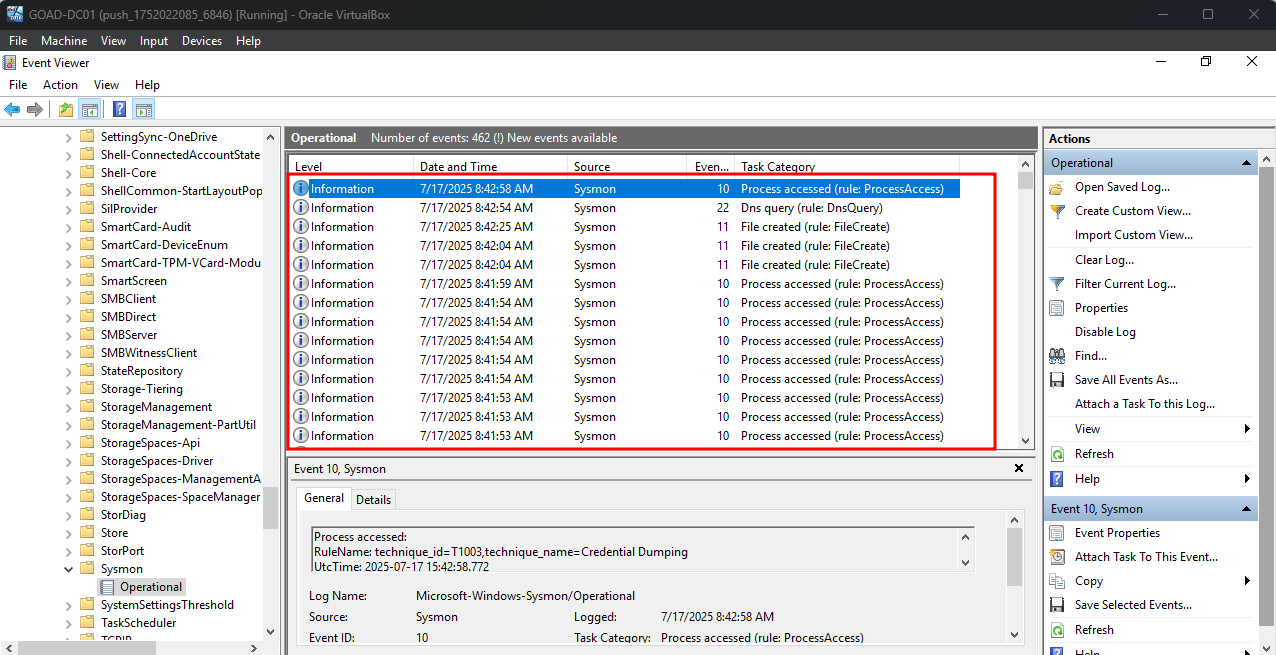
Check Sysmon event logs in Windows Event Viewer
Ensure Wazuh Agent is Forwarding Logs
Wazuh agent on Windows should already collect Windows Event Logs via the eventchannel module.
Verify the ossec.conf on the agent includes:
<localfile>
  <location>Microsoft-Windows-Sysmon/Operational</location>
  <log_format>eventchannel</log_format>
</localfile>
or using the powershell command
Select-String -Path "C:\Program Files (x86)\ossec-agent\ossec.conf" -Pattern "Microsoft-Windows-Sysmon"
If not, you can either add it manually then restart the agent:
net stop wazuh
net start wazuh
Or you can create a shared configuration for an agent group on Wazuh manager, then it will automatically populate the agents on the windows hosts, which would be best in our case since we have multiple Windows hosts
Set Up a Shared Configuration
Wazuh allows you to define a shared configuration that applies to all agents assigned to a specific group. This centralized setup overrides the local ossec.conf file on each agent.
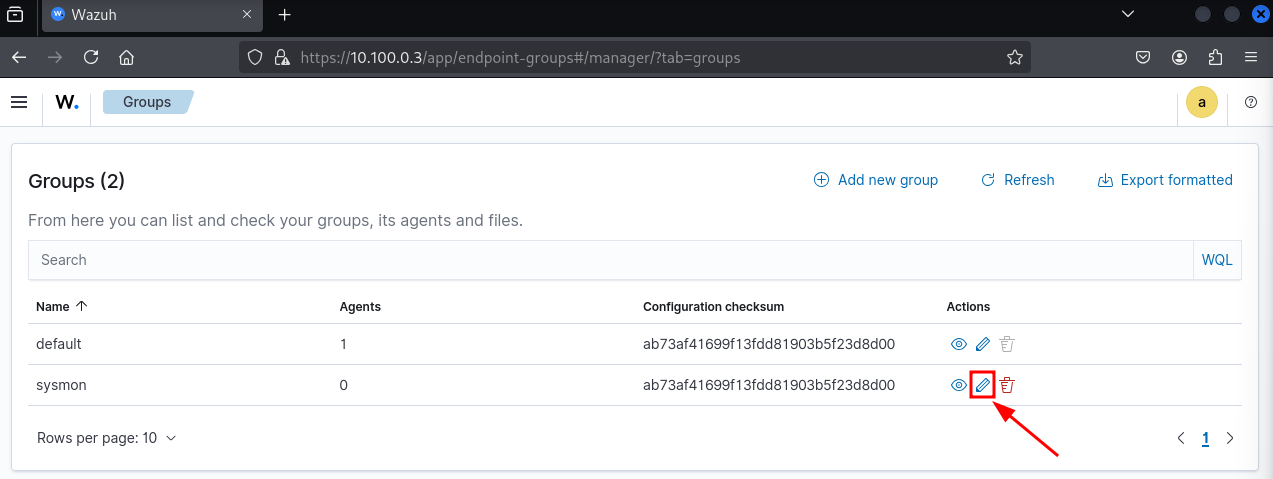
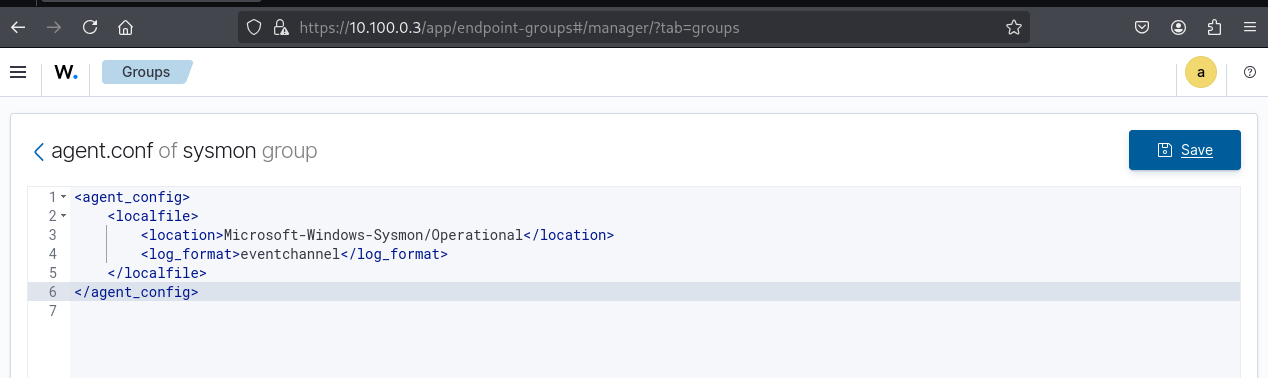
To configure this, locate your newly created sysmon group and click the Edit (pencil icon) to open the shared configuration editor. Add the following XML snippet:
This shared configuration only applies to agents assigned to the sysmon group. Agents outside this group won’t receive these settings.
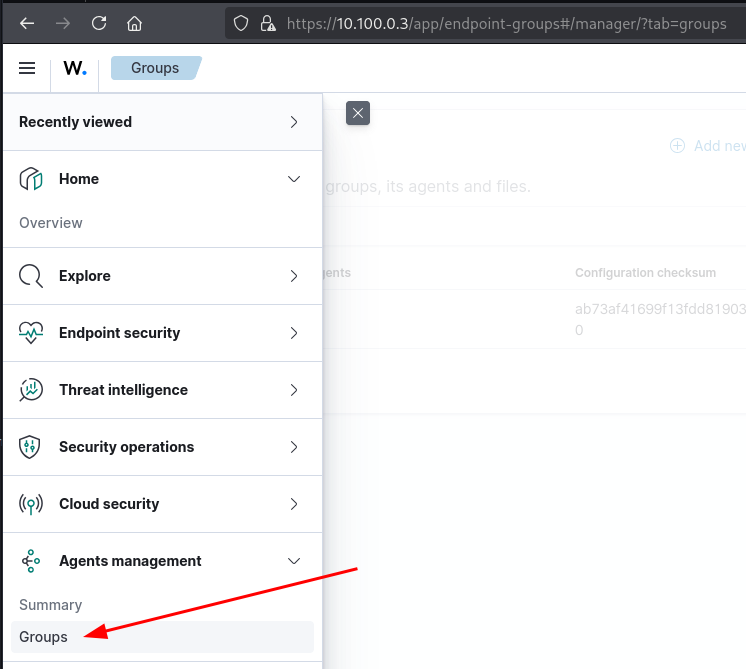
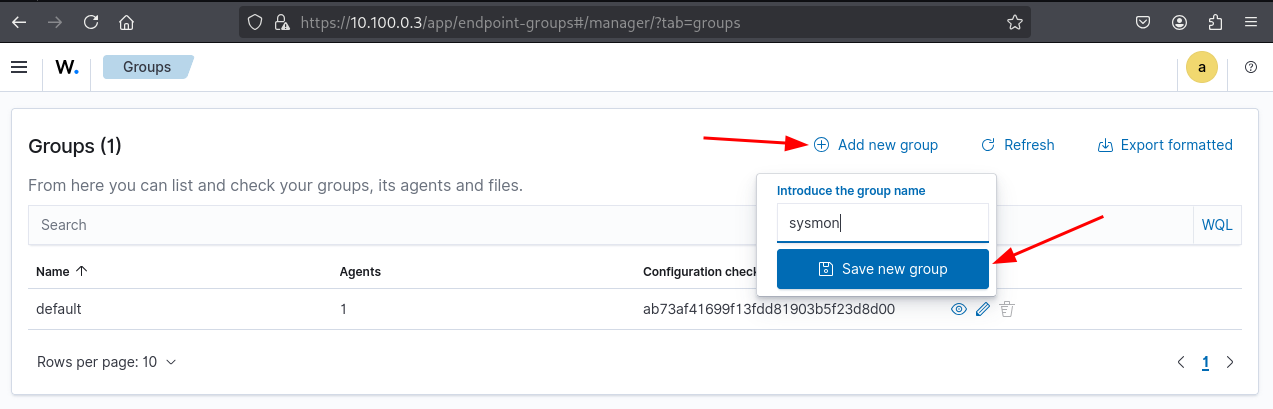
Navigate to Management > Groups and create a new group named sysmon.
Create a shared group configuration in Wazuh Manager
Add eventchannel for Sysmon in the shared configuration group
Assign Windows agents to the new Sysmon group
<agent_config>
    <localfile>
        <location>Microsoft-Windows-Sysmon/Operational</location>
        <log_format>eventchannel</log_format>
    </localfile>
</agent_config>
Confirm group assignment and apply configuration to agents
Assign Agents to the Group
By default, your sysmon group has no agents assigned. To associate Windows agents that have Sysmon installed:
Click on the sysmon group, then select Manage agents.
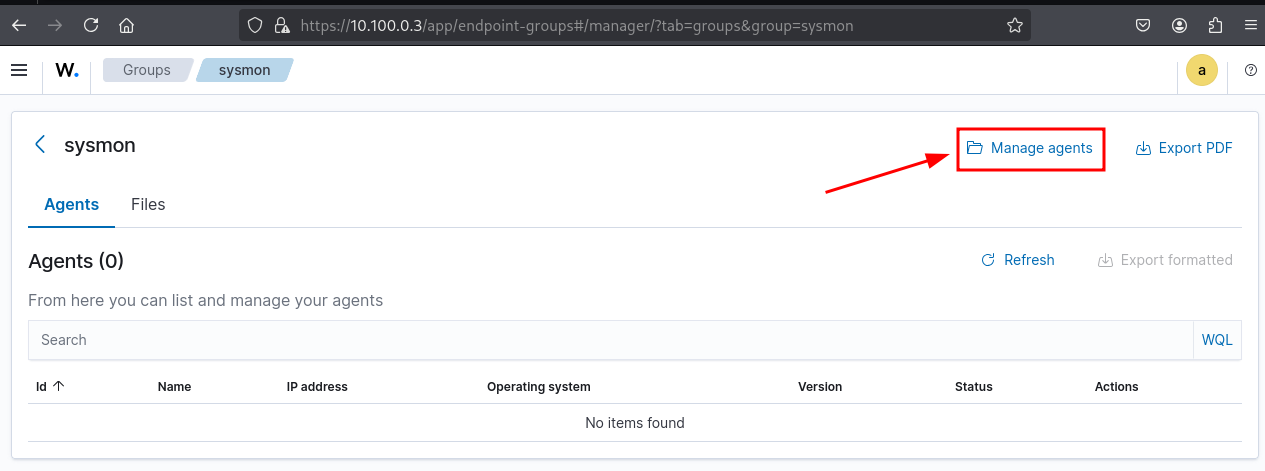
Manage and assign Sysmon-enabled agents to the Wazuh group
Choose the Windows agents where Sysmon is running.
Click Add selected items, then Apply changes.
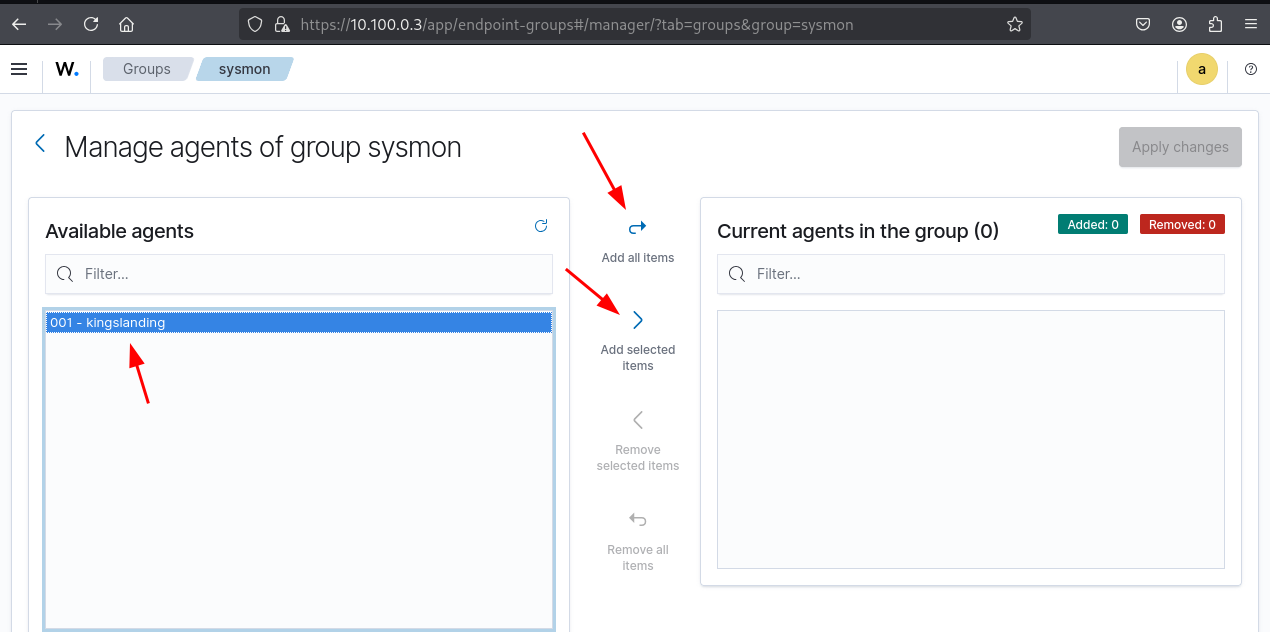
Apply changes after agent selection in the group configuration
We would need to do the same thing on for all the other agents on the other GOAD VMs after installing them
After assigning agents, the Wazuh Manager will automatically push the shared configuration to them, triggering a restart of each agent to apply the changes.
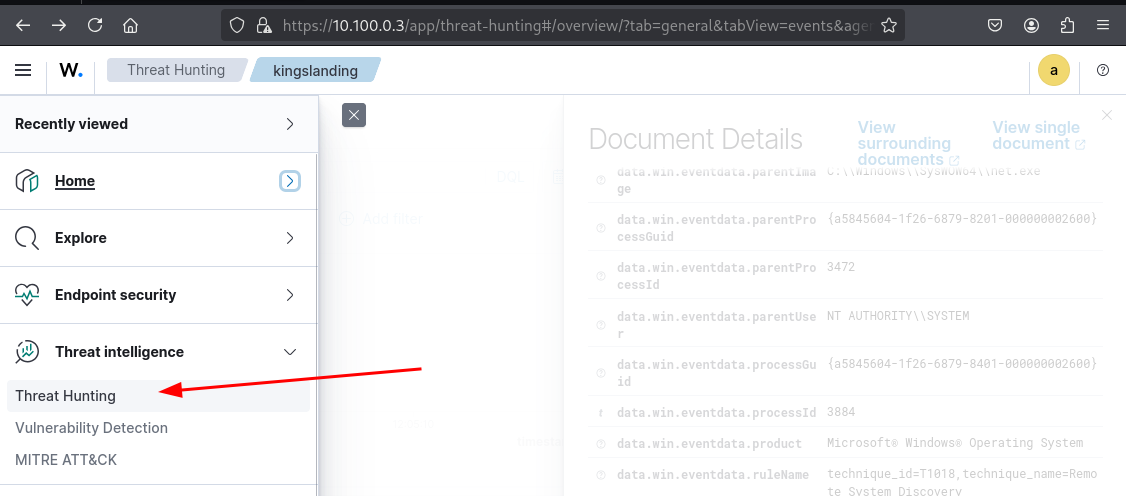
Verify that Sysmon logs are being parsed correctly by Wazuh
data.win.system.channel
is
Microsoft-Windows-Sysmon/Operational
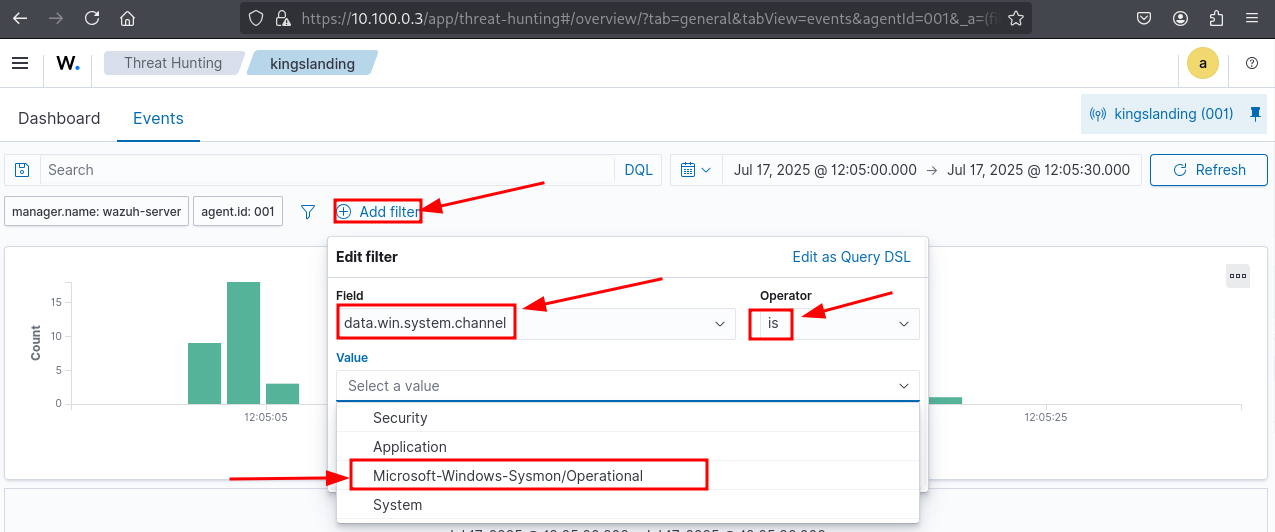
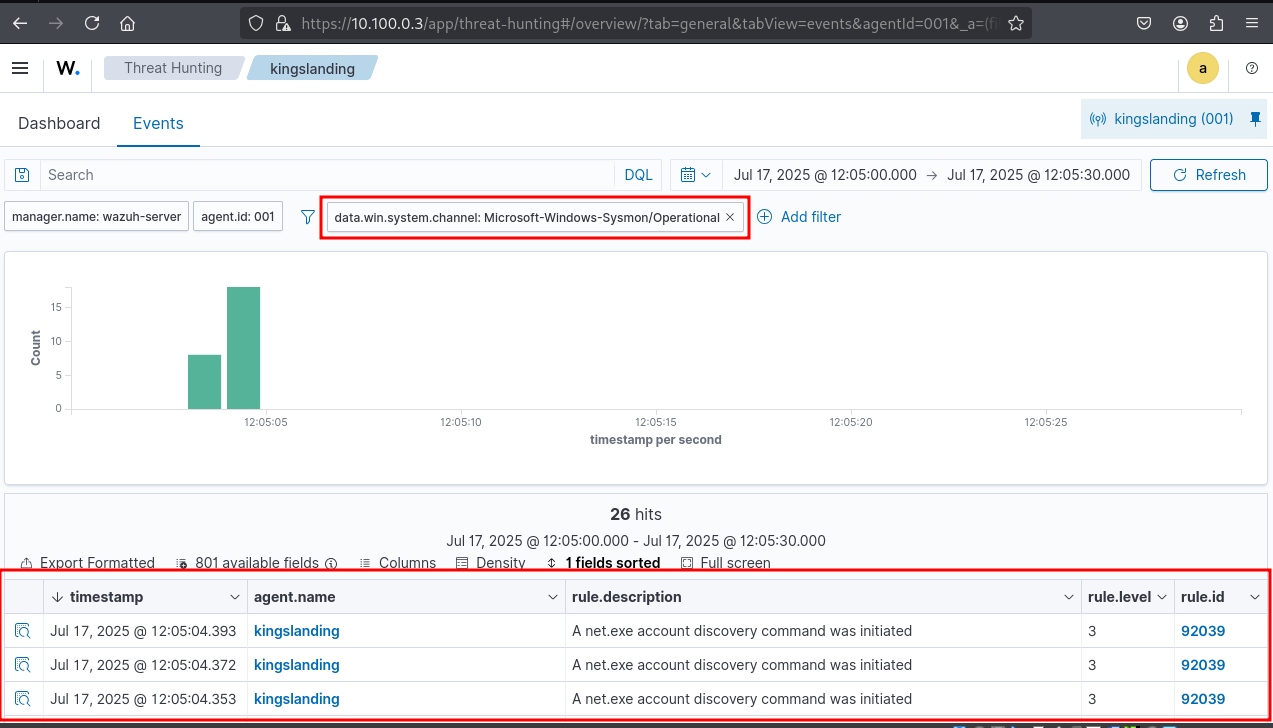
Verify the Sysmon event channel is Microsoft-Windows-Sysmon/Operational
On the windows, you can use a simple enumeration command that shows the domain's users
net user /domain
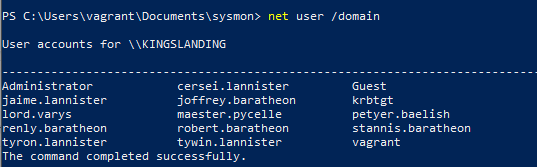
Enumerate domain users via command-line to test audit detection
Adjust time settings on GOAD VMs to match lab environment
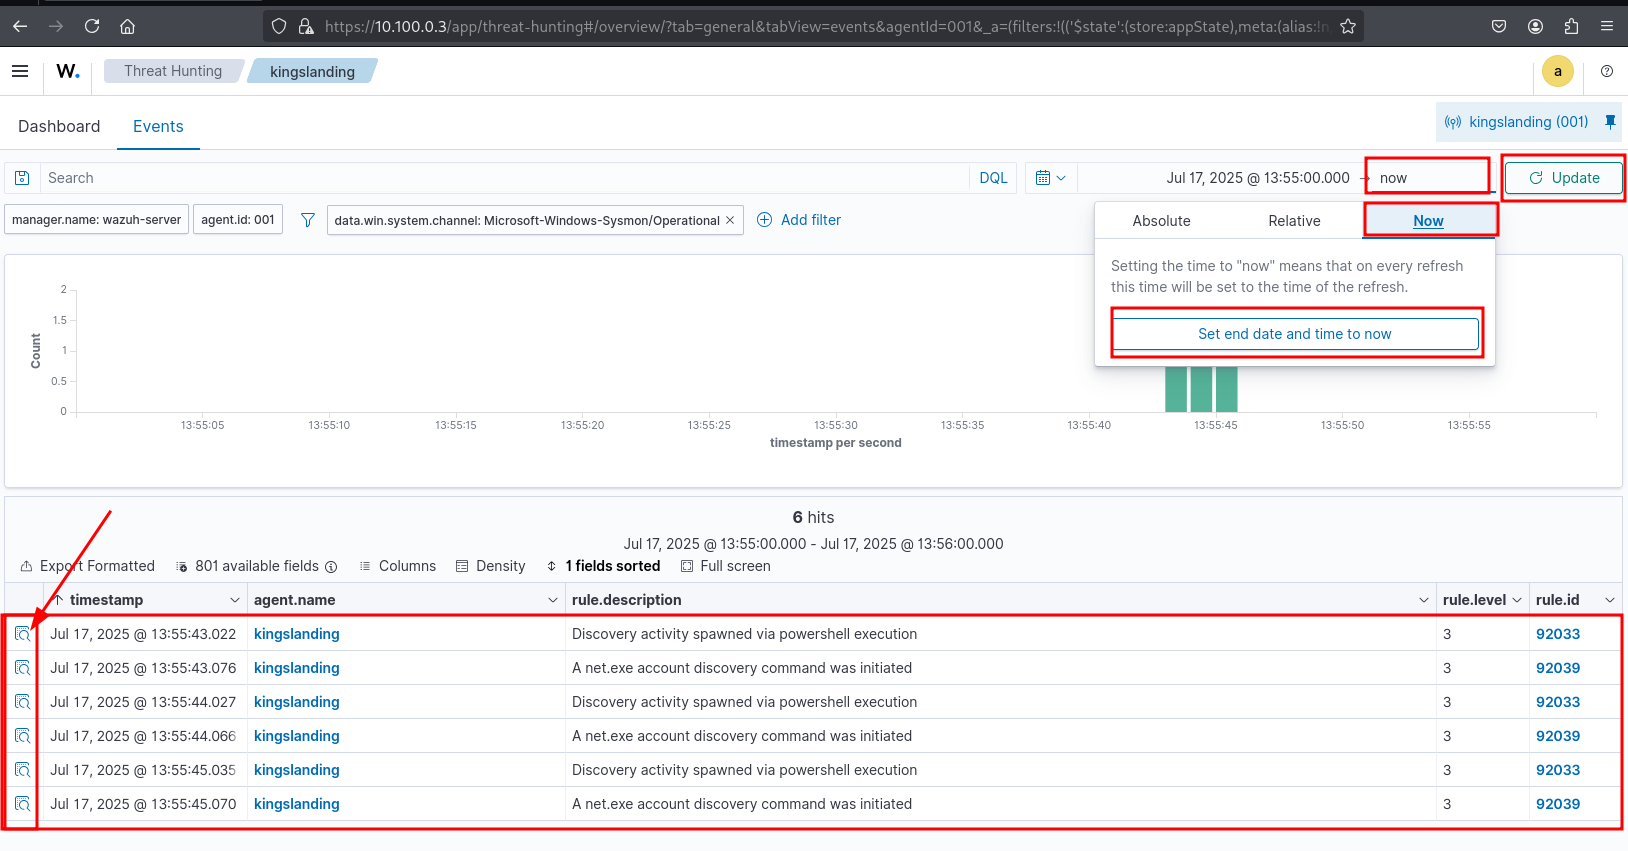
Ensure NTP or manual time sync for accurate logging and correlation
Once Sysmon logs are visible in Wazuh, you can test how rules parse them using the CLI utility
/var/ossec/bin/wazuh-logtest
that allows the testing and verification of decoders and rules against provided log samples on the Wazuh server. You can read up more on that here
While at first Wazuh didn't have much rulesets for sysmon, it now comes pre-equipped with them, We can see the sysmon ruleset files
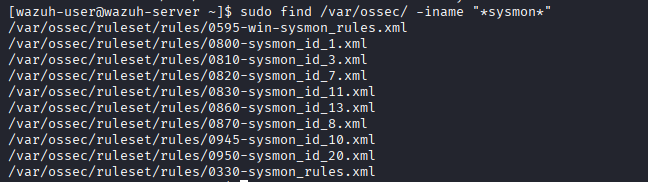
Predefined Sysmon ruleset files present on the Wazuh manager
We can add custom rulesets by creating. There are some community driven ones available online, which we can take finetune you can pick any one of them and start fine tuning You can pick any one of them and start fine tuning. Remember that filesystem and registry events are covered by FIM already. It is better to exclude those event IDs from the configuration I suggest you to pick any well-known solution, remove the one that are covered by FIM and implement on a test computer. You can then fine-tune yourself in time. When it is good enough, deploy in small batches and continue fine tuning. That's the only sane way.
- Default Wazuh rules detect common things (e.g. process creation, network traffic).
- But if you want specific detection (e.g., suspicious command-line args, PowerShell obfuscation), you need custom rules.
Wazuh Sysmon Rules Are Here:
On the manager:
/var/ossec/etc/rules/0215-windows_sysmon_rules.xml
You can create local custom rules in:
/var/ossec/etc/rules/local_rules.xml
Example rule for suspicious PowerShell:
<group name="sysmon, windows">
  <rule id="100010" level="10">
    <if_sid>61610</if_sid> <!-- Depends on original SID of event -->
    <match>powershell.exe</match>
    <match>EncodedCommand</match>
    <description>Suspicious PowerShell Encoded Command</description>
    <mitre>
      <id>T1059.001</id>
      <tactic>Execution</tactic>
    </mitre>
  </rule>
</group>
Reload Rules
After saving your custom rules:
/var/ossec/bin/wazuh-control restart
Wazuh index management
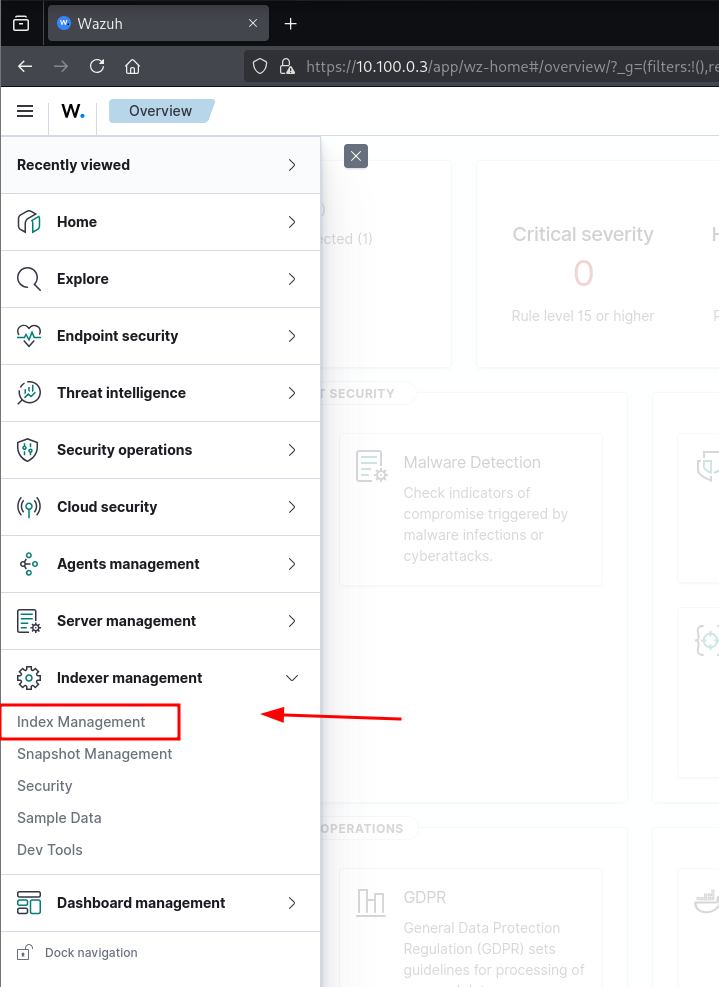
Check existing Wazuh index configurations in the dashboard
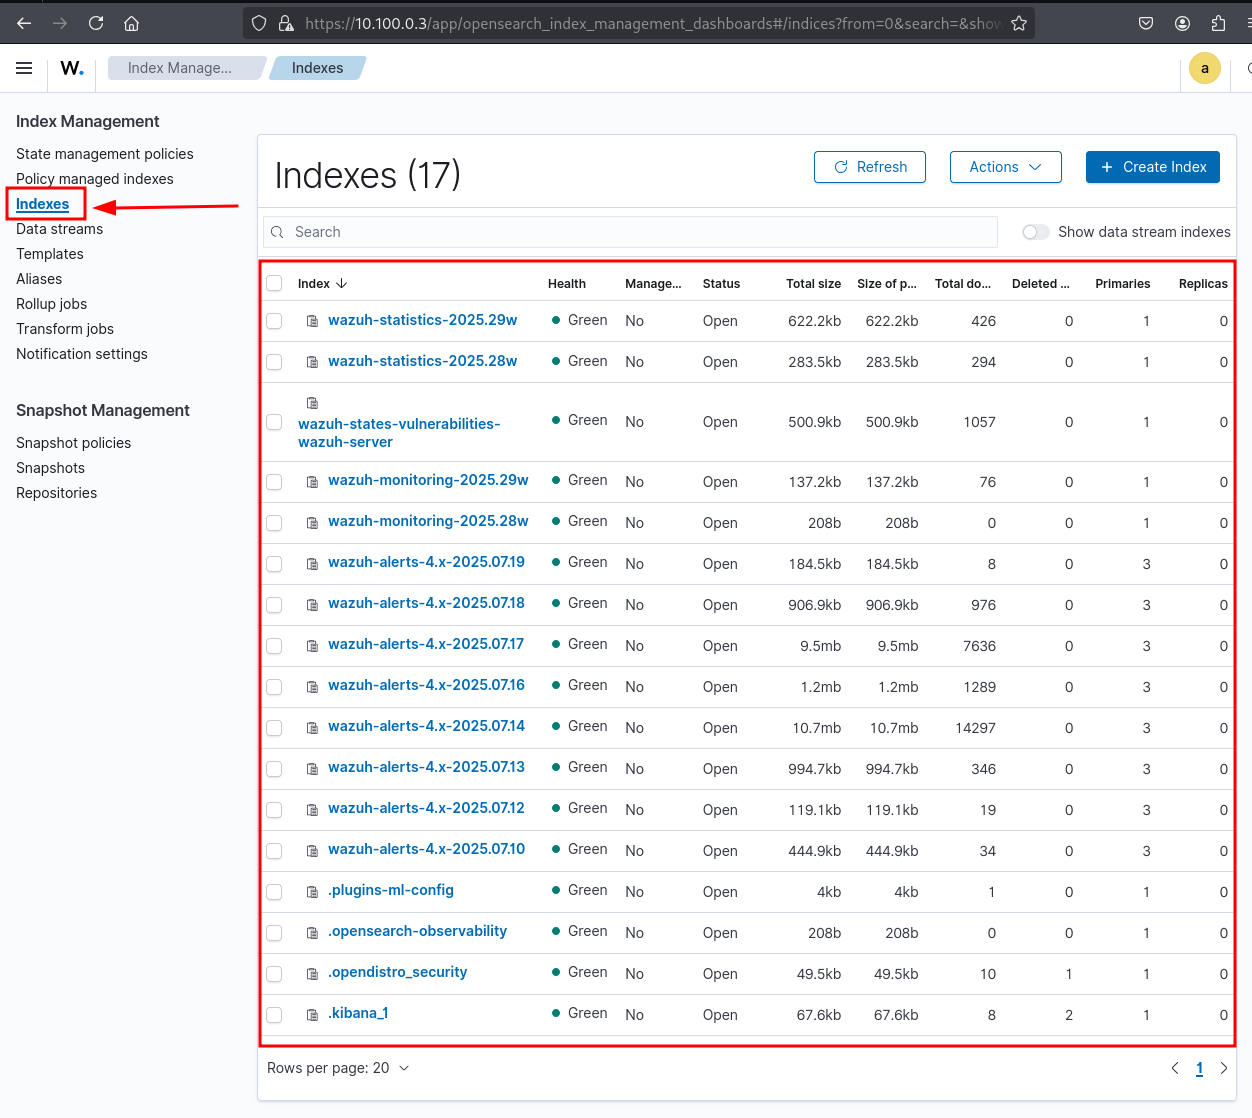
List of all active indices managed by Wazuh Indexer
Referring to : Index lifecycle management from the official documentation
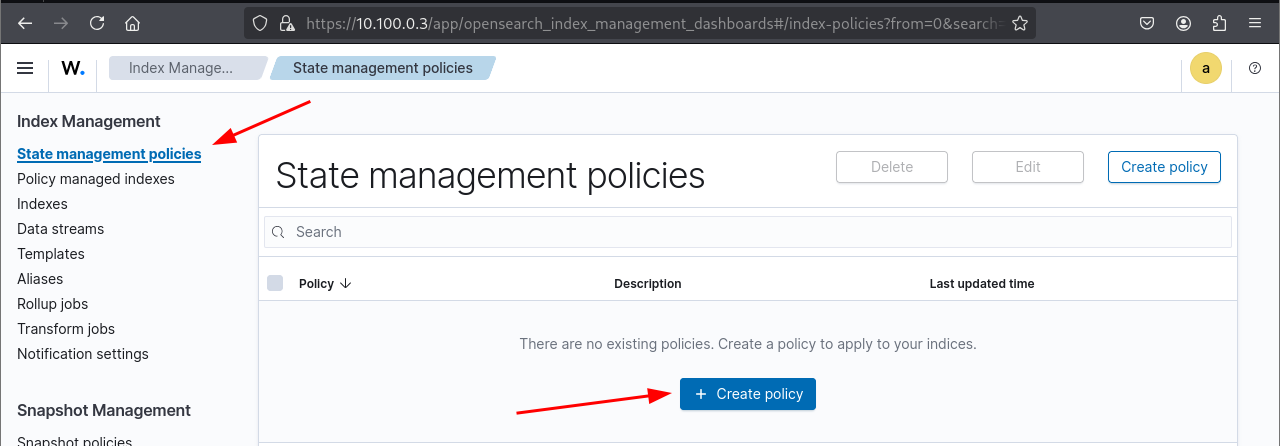
View lifecycle policies available in the Wazuh Index Manager
Create a new index lifecycle policy for Wazuh logs
named it wazuh-index-state-policy
{
    "policy": {
        "description": "Lifecycle policy for Wazuh indices: hot for 7 days, then cold for 7 days, and finally deleted.",
        "default_state": "hot",
        "states": [
            {
                "name": "hot",
                "actions": [
                    {
                        "replica_count": {
                            "number_of_replicas": 1
                        }
                    }
                ],
                "transitions": [
                    {
                        "state_name": "cold",
                        "conditions": {
                            "min_index_age": "7d"
                        }
                    }
                ]
            },
            {
                "name": "cold",
                "actions": [
                    {
                        "read_only": {}
                    }
                ],
                "transitions": [
                    {
                        "state_name": "remove",
                        "conditions": {
                            "min_index_age": "14d"
                        }
                    }
                ]
            },
            {
                "name": "remove",
                "actions": [
                    {
                        "delete": {}
                    }
                ],
                "transitions": []
            }
        ],
        "ism_template": [
            {
                "index_patterns": [
                    "wazuh-*"
                ],
                "priority": 100
            }
        ]
    }
}
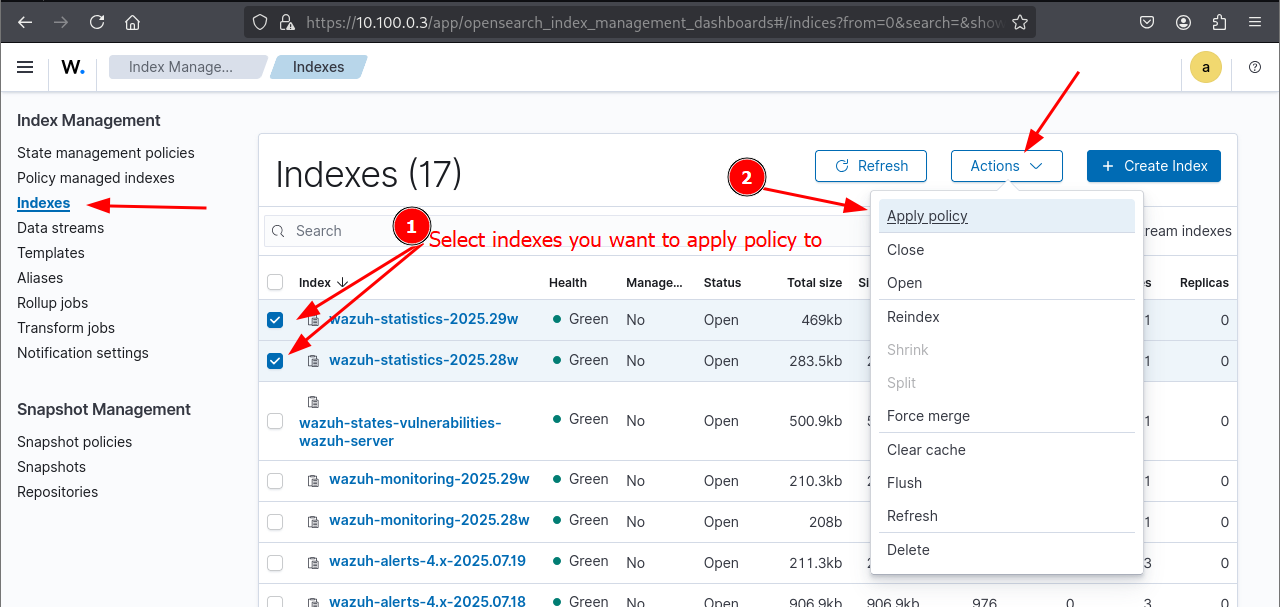
Applying the Policy to Existing Indices
When new indices are created by the Wazuh Indexer, the policy is automatically assigned based on the index pattern. However, this assignment doesn't apply retroactively to indices that already exist. You'll need to manually attach the policy to those indices using the API — but don't worry, it's straightforward.
Assign lifecycle policy to existing indices via the API
Assuming your policy targets index names matching:
wazuh*
...you'll need to run API requests for each relevant index pattern.
POST _opendistro/_ism/add/wazuh-*
{
  "policy_id": "wazuh-index-state-policy"
}
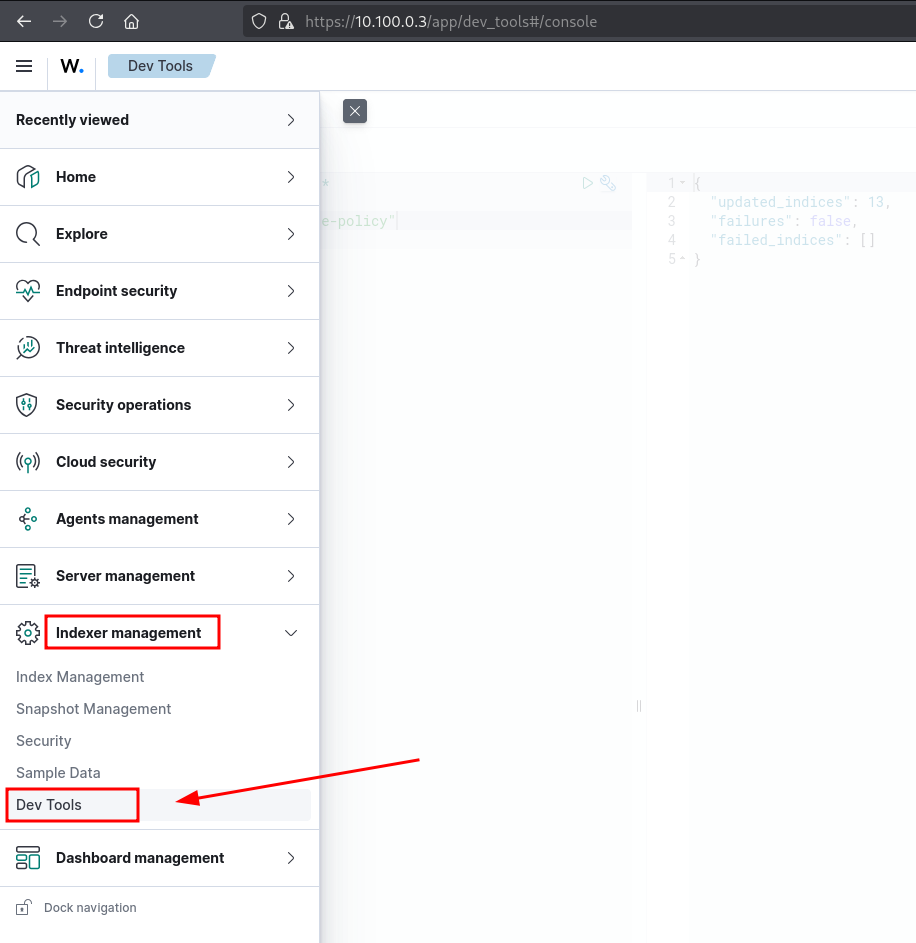
You can use this endpoint in Dev Tools within OpenSearch Dashboards or via curl (if you expose the API)
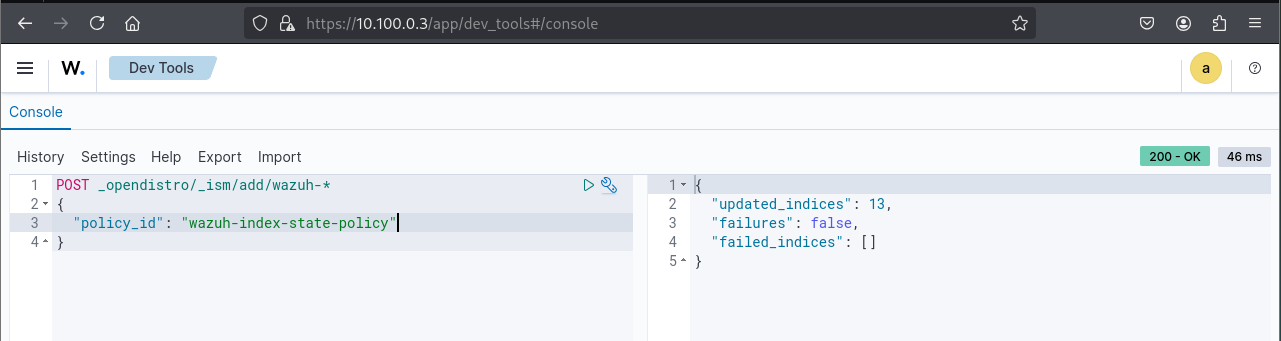
Confirm successful policy assignment to wazuh-* indices
Updating the Policy
If you make changes to your policy later on, remember: policy updates aren’t applied automatically to previously linked indices. You’ll need to reassign the updated policy manually, just like you did initially.
Here’s an example API call:
POST _plugins/_ism/change_policy/wazuh-*
{
  "policy_id": "wazuh-index-state-policy"
}
This request uses the
change_policyendpoint to link the policy to existing indices.
Let me know if you want to automate this with a script or add error handling.
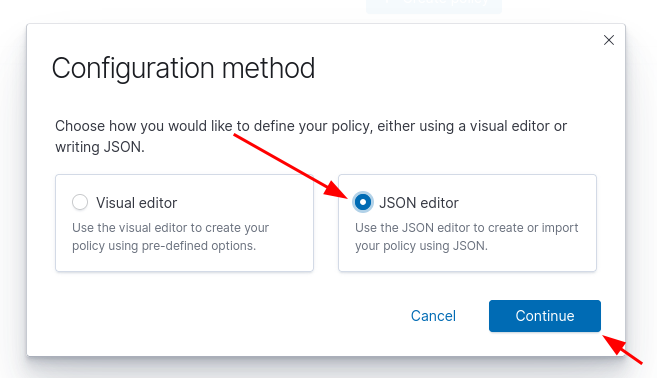
Manually apply a policy to an index
Once the policy is created, you can apply it to new indexes without having to rewrite it
Policy successfully applied to index pattern 'wazuh-*'
Since this JSON defines an Index State Management (ISM) policy for a testing environment (homelab), the lifecycle is designed to manage index storage efficiently, assuming that: Tests don’t last more than 15 days, so there’s no need to retain logs beyond that.
hot state (0–7 days):
- Indices are active and writeable
- 1 replica is maintained for redundancy
- After 7 days, indices transition to
cold
cold state (7–14 days):
- Indices become read-only
- Suitable for infrequent access (e.g., reviewing test logs)
- After 14 days, they are marked for deletion
remove state (14+ days):
- Indices are automatically deleted
- Keeps storage clean and avoids unnecessary bloat in a testing environment
Feel free to change these periods if you expect some edge-case tests might run slightly longer.
Only apply lifecycle policies to indices that can be safely archived or deleted, like wazuh-* or filebeat-*. Avoid system and configuration indices such as kibana-*, .opendistro_security, or .opensearch-observability, as they contain critical configuration data. Rotating, making them read-only, or deleting them can break functionality or lock you out of OpenSearch.
When adding new index types to your Wazuh setup (e.g., for custom modules or logs), remember to update your Index State Management (ISM) policy accordingly. Either:
- Add the new index pattern (e.g.,
wazuh-custom-*) to an existing policy, or - Create a new policy with rules tailored to its retention and usage.
Forgetting to do this may leave new indices unmanaged, bloating storage or missing necessary retention logic.
Before defining how long indices should be retained, review applicable retention policies and legal requirements.
For example:
- GDPR (EU): personal data should not be stored longer than necessary for the purpose of collection.
- HIPAA (US): healthcare logs may require retention for 6 years.
- PCI DSS: recommends log retention for at least 1 year, with 3 months immediately available.
You can also refer to internal policies, security standards like ISO/IEC 27001, or national cybersecurity agency guidelines (e.g., ANSSI in France or NIST in the US).
Tailor your ISM policies to meet these requirements and regularly audit them to ensure compliance.
Congratulations !
You now have a fully integrated Wazuh-based detection stack in your homelab, complete with Suricata network monitoring, Sysmon endpoint telemetry, and centralized log analysis through the Wazuh Manager.
Proceed to the next section if you want to deploy the full lab or add one of the environnements described here.